Item
Moody's Global COVID-19 impact heatmap
Title (Dublin Core)
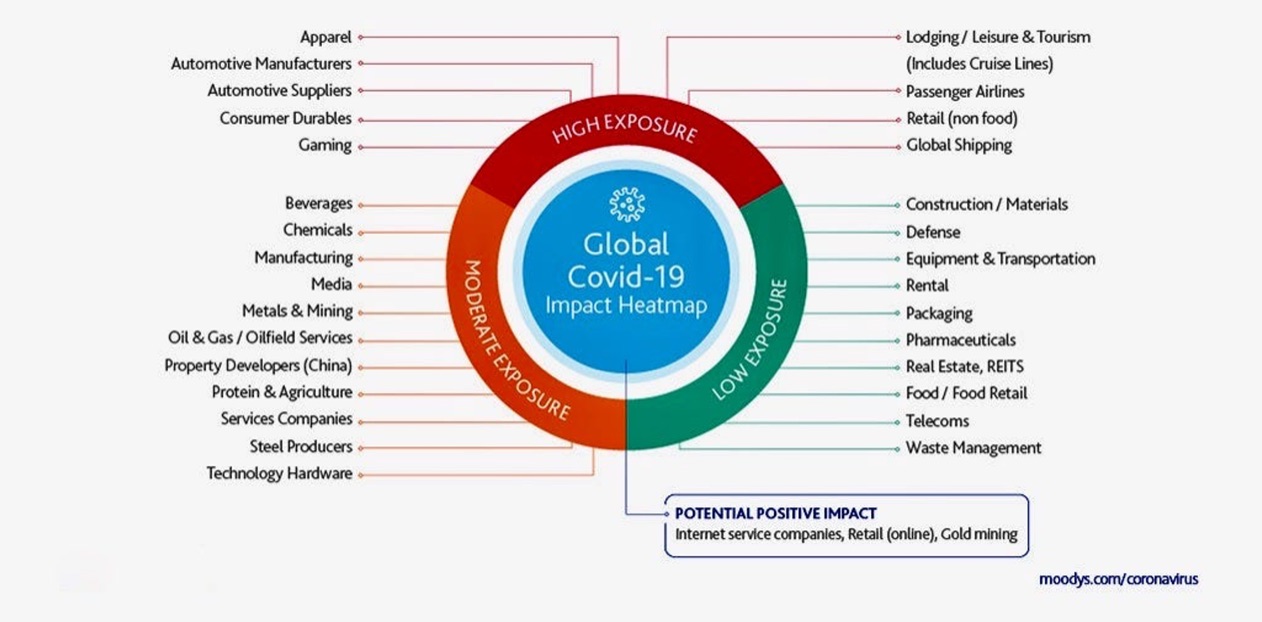
Moody's Global COVID-19 impact heatmap
Disclaimer (Dublin Core)
DISCLAIMER: This item may have been submitted in response to a school assignment prompt. See Linked Data.
Description (Dublin Core)
It shows the lowest to highest industries affected by the pandemic, and sorts them by positive, low, moderate and high exposure levels.
*It is an infographic categorizing industries with positive, low, moderate and high exposure (or risk) as a result of the COVID-19 pandemic.
*It is an infographic categorizing industries with positive, low, moderate and high exposure (or risk) as a result of the COVID-19 pandemic.
Date (Dublin Core)
Creator (Dublin Core)
Contributor (Dublin Core)
Event Identifier (Dublin Core)
Partner (Dublin Core)
Type (Dublin Core)
Infographic
Link (Bibliographic Ontology)
Source (Dublin Core)
Moody's
Publisher (Dublin Core)
Moody's
Controlled Vocabulary (Dublin Core)
Curator's Tags (Omeka Classic)
Collection (Dublin Core)
Linked Data (Dublin Core)

Curatorial Notes (Dublin Core)
Date Submitted (Dublin Core)
04/27/220
Date Modified (Dublin Core)
05/01/2020
11/14/2020
06/27/2023
Date Created (Dublin Core)
04/23/2020
Accrual Method (Dublin Core)
2566