Item
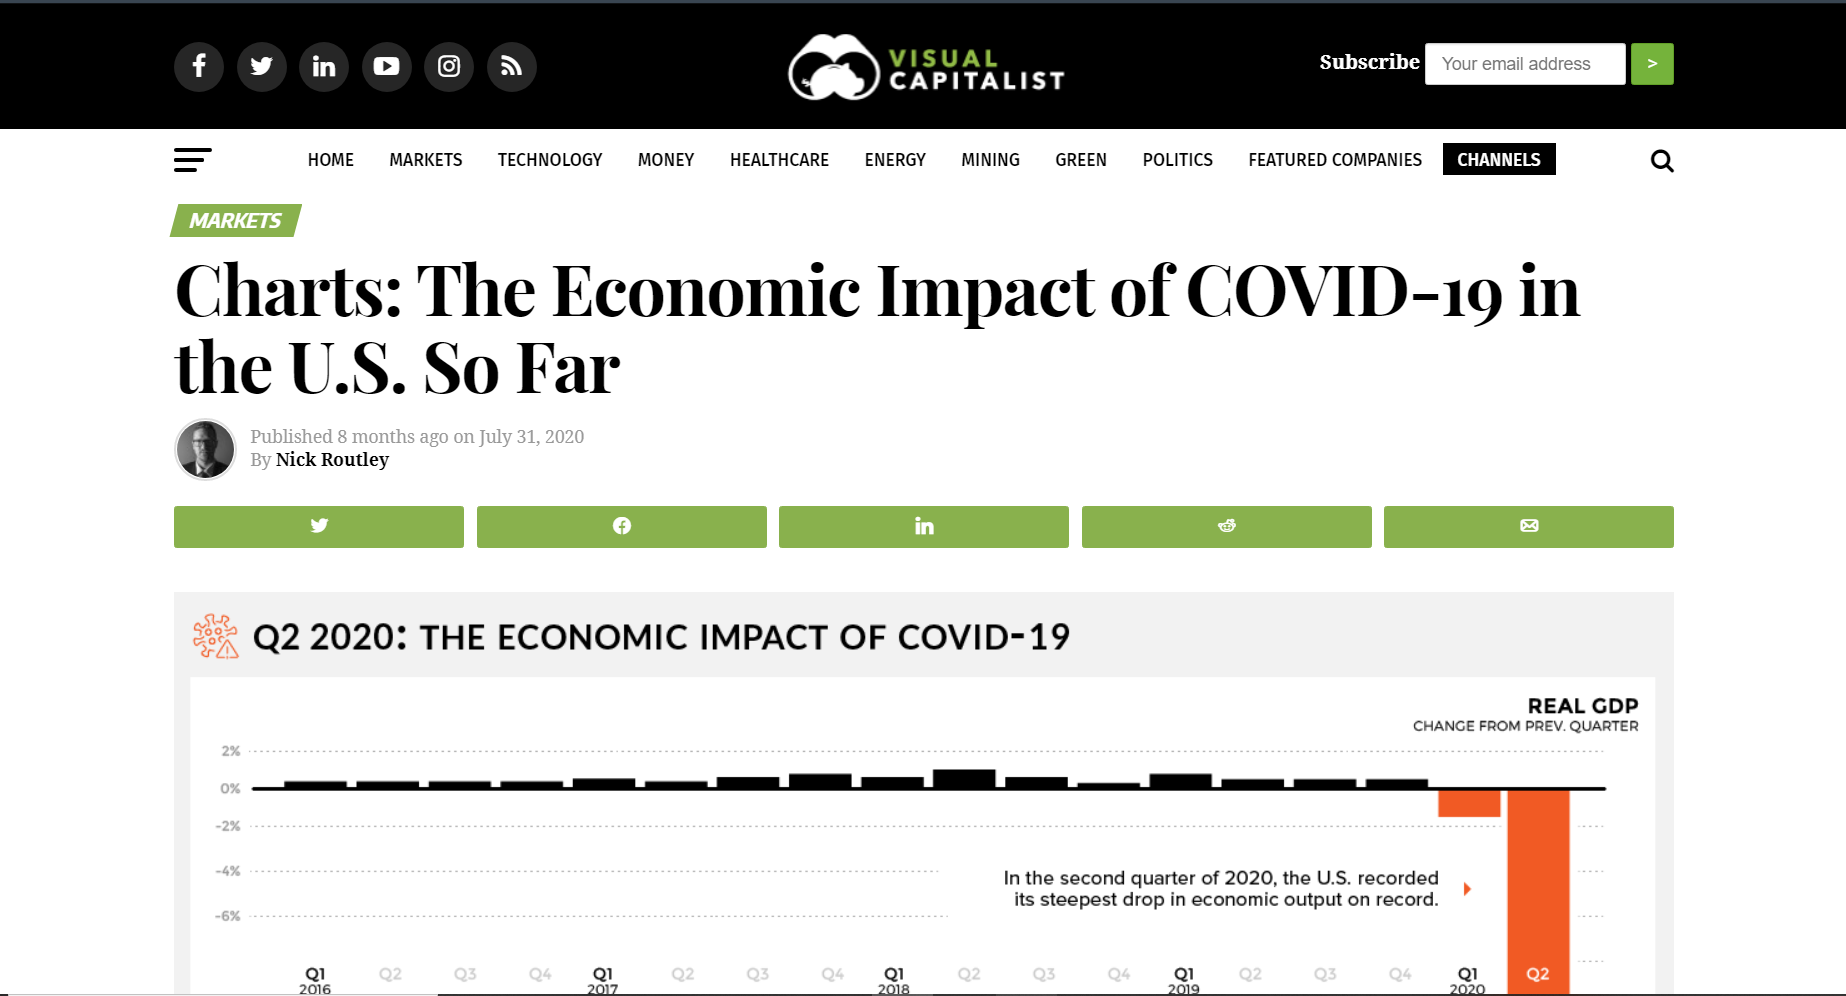
Charts: The Economic Impact of COVID-19 in the U.S. So Far
Title (Dublin Core)
Charts: The Economic Impact of COVID-19 in the U.S. So Far
Description (Dublin Core)
This article provides a break down of the big picture of United States economics in the past few months. This break down includes simplistic graphs of the following: consumer spending, national debt, U.S. money supply, consumer sentiment, fed balance sheet, U.S. dollar, fiscal expenditures, inflation rate, and loans to the private sector. These grids provide a representation of how COVID-19 has impacted the United States in a variety of different ways. The article also has short descriptions of each segment that provides the reader with more detailed information. This article provides statistical analysis and quantitative evidence depicting the economic downfall that the United States has faced due to this global pandemic.
Date (Dublin Core)
Creator (Dublin Core)
Contributor (Dublin Core)
Event Identifier (Dublin Core)
Partner (Dublin Core)
Type (Dublin Core)
link
Link (Bibliographic Ontology)
Controlled Vocabulary (Dublin Core)
English
Emotion
English
Business & Industry
English
Economy
English
Entrepreneurs
English
Government Federal
Contributor's Tags (a true folksonomy) (Friend of a Friend)
Collection (Dublin Core)
Linked Data (Dublin Core)

Date Submitted (Dublin Core)
8/17/2020
Date Modified (Dublin Core)
8/17/2020
11/12/2020
02/22/2021
03/12/2021
04/02/2021
08/02/2022
09/25/2024
Date Created (Dublin Core)
07/31/2021
This item was submitted on August 17, 2020 by Katrina Beattie using the form “Share Your Story” on the site “A Journal of the Plague Year”: https://covid-19archive.org/s/archive
Click here to view the collected data.