Item
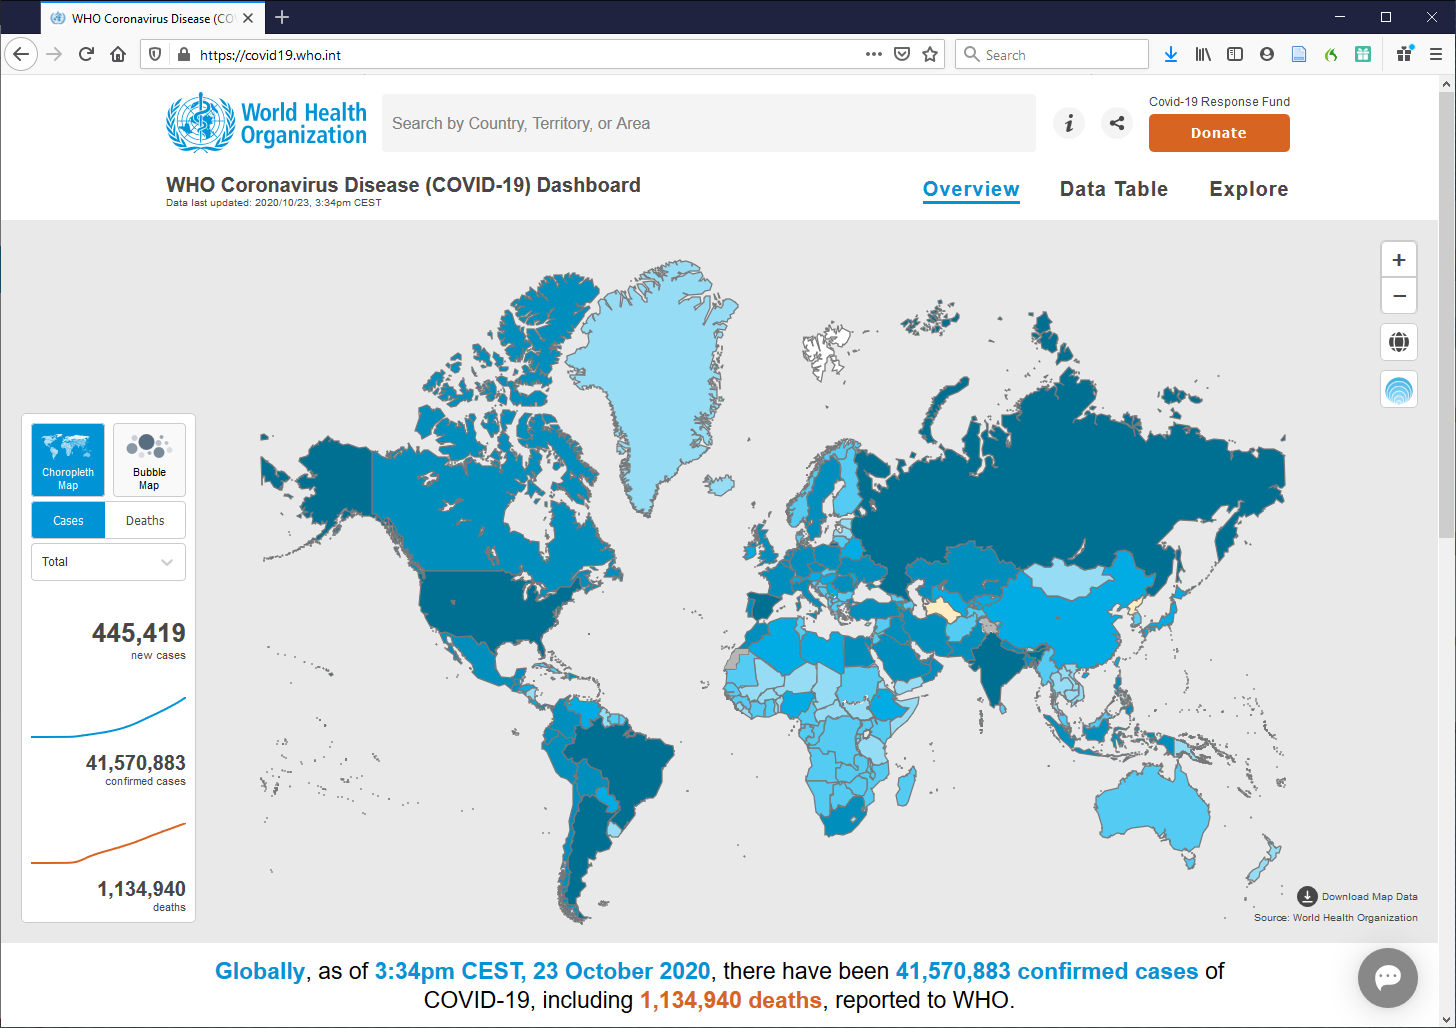
WHO’s COVID-19 Infection map, 23 Oct 2020
Title (Dublin Core)
WHO’s COVID-19 Infection map, 23 Oct 2020
Description (Dublin Core)
The WHO is an authoritative source for tracking COVID-19 infection rates via various countries Centers of Disease Control. For several months, most countries contained COVID-19 infection rates. As expected, infection rates dramatically increased as governments relaxed restrictions. This represented the forecasted second-wave. Unlike the first wave, mortality rates were much lower. Several possible causes from improved pre-vaccinne treatment plans to poor testing and tacking during first wave biased mortality rates. Lastly, it represented born-digital content regarding COVID-19.
Date (Dublin Core)
Creator (Dublin Core)
Contributor (Dublin Core)
Type (Dublin Core)
screenshot
Link (Bibliographic Ontology)
Controlled Vocabulary (Dublin Core)
Curator's Tags (Omeka Classic)
Contributor's Tags (a true folksonomy) (Friend of a Friend)
Date Submitted (Dublin Core)
10/27/2020
Date Modified (Dublin Core)
10/30/2020
Item sets
This item was submitted on October 27, 2020 by john lokka using the form “Share Your Story” on the site “A Journal of the Plague Year”: https://covid-19archive.org/s/archive
Click here to view the collected data.