Item
Eddy County, New Mexico: Comparing The Curve
Title (Dublin Core)
Eddy County, New Mexico: Comparing The Curve
Description (Dublin Core)
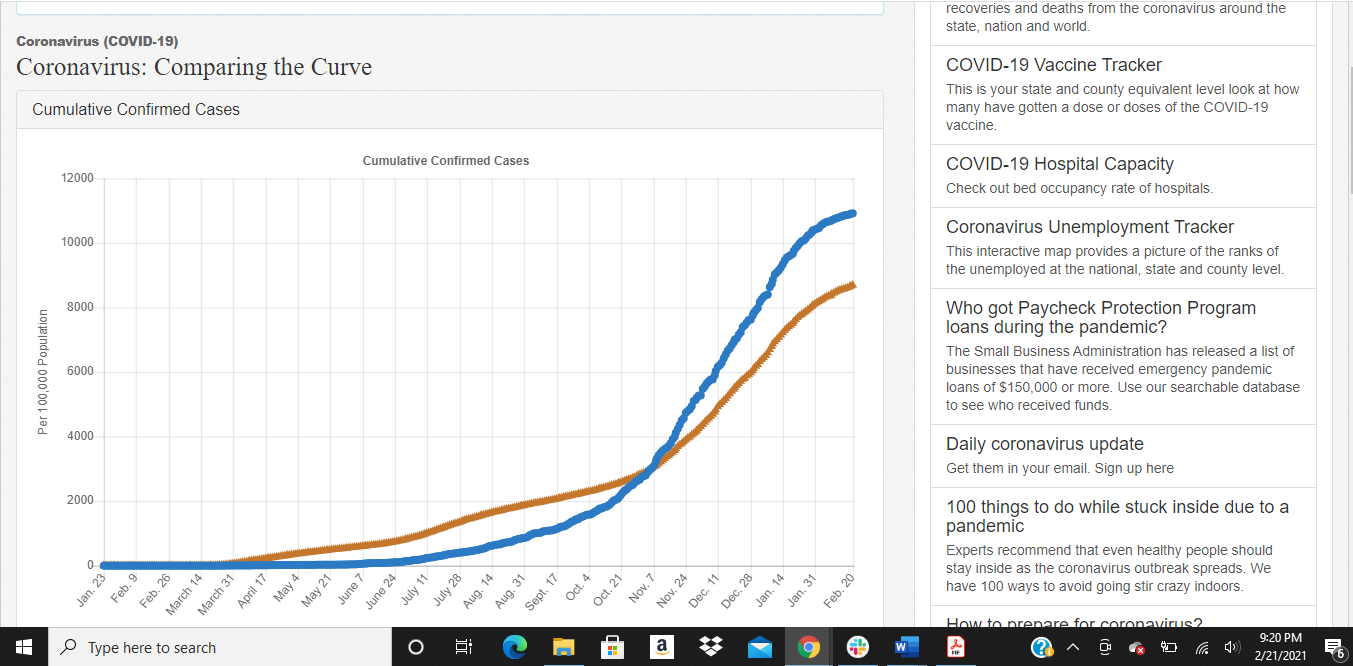
These graphs illustrate the to-date experience of COVID-19 infections and known positivity rates for Eddy County (NM), the State of New Mexico, and the United States. This data demonstrates dichotomies in the experiences of that county, the state, and the nation from the beginning of 2020 through February 6, 2021. Such data provides context to discussions and debate on public behavior, public health policy, and executive actions taken within the State and the County. This is important to me because many of my close and extended family members still reside in and around Eddy County, and the infection rates and restrictions they have endured has been especially tough on them and their community.
Date (Dublin Core)
Creator (Dublin Core)
Contributor (Dublin Core)
Event Identifier (Dublin Core)
Partner (Dublin Core)
Type (Dublin Core)
PDF of a webpage
Link (Bibliographic Ontology)
Controlled Vocabulary (Dublin Core)
English
Education--Universities
English
Government Federal
English
Government State
English
Health & Wellness
Curator's Tags (Omeka Classic)
Contributor's Tags (a true folksonomy) (Friend of a Friend)
Collection (Dublin Core)
Linked Data (Dublin Core)
Date Submitted (Dublin Core)
02/07/2021
Date Modified (Dublin Core)
02/21/2021
08/02/2022
09/18/2024
This item was submitted on February 7, 2021 by James Rayroux using the form “Share Your Story” on the site “A Journal of the Plague Year”: https://covid-19archive.org/s/archive
Click here to view the collected data.