Items
topic_interest is exactly
data
-
 2020-12
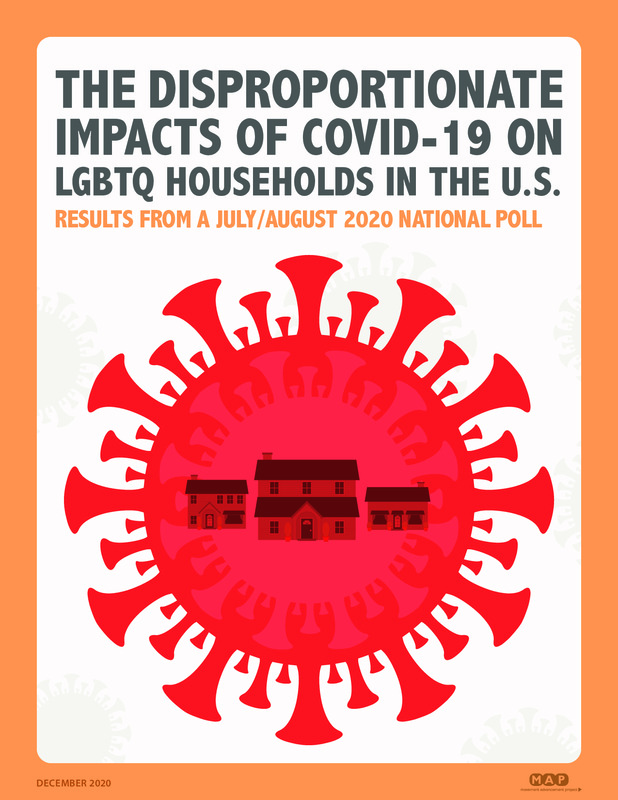
The impact of COVID on the LGBTQ+ Community
This PDF details data related to the LGBTQ+ Community's relationship with COVID in America. Based on the data, it is clear many within the community struggled with excessive financial issues, the inability to receive medical care, and the loss of insurance. While the pandemic has placed serious burdens as a whole on society, data such as this is valuable as it allows a look into the most vulnerable communities within society already, and how COVID has destroyed the once normal lives of so many. -
 2022-07-08
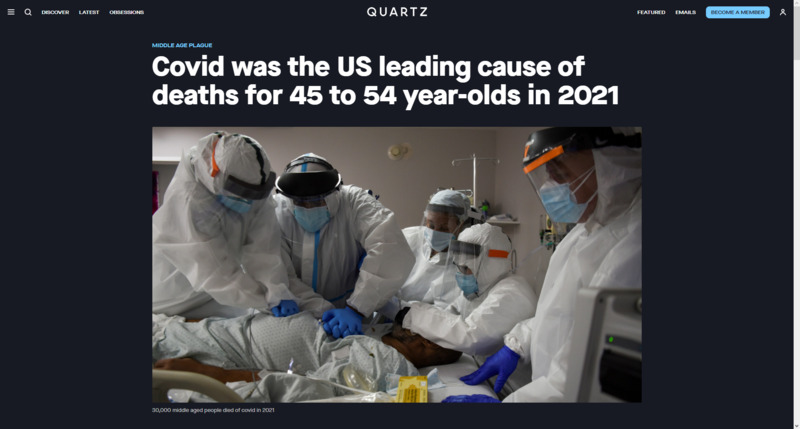
Covid was the US leading cause of deaths for 45 to 54 year-olds in 2021
This is a news story from Quartz by Annalisa Merelli. This news story says that within the deaths that occurred between March 2020 and October 2021, the middle-aged were disproportionately affected. In the 45 to 54 age group, COVID killed more than any other leading causes of death within that time period, including heard disease and cancer. -
 2022-06-25
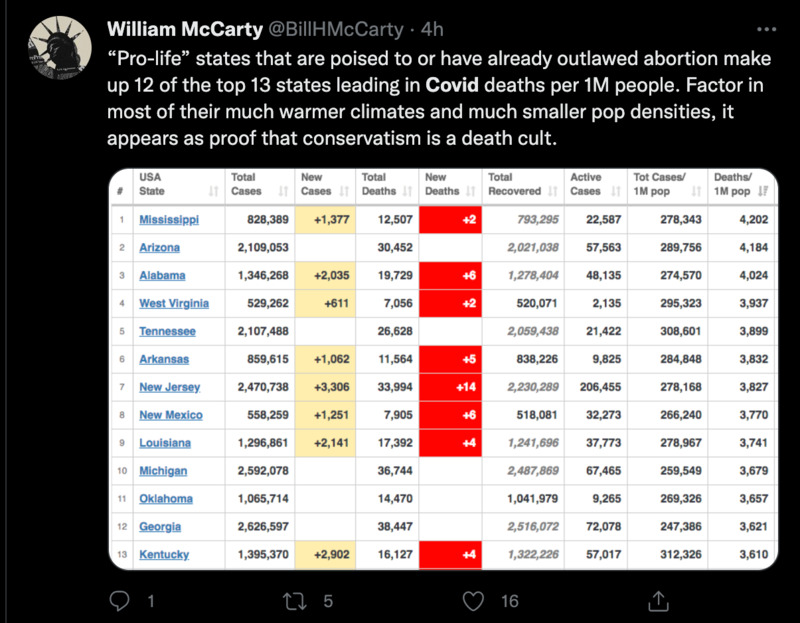
"Pro-life" and COVID death
This is a tweet from BillHMcCarty. This person is criticizing the amount of COVID deaths that are happening is states that are looking to outlaw or heavily restrict abortion. -
 2022-06-15
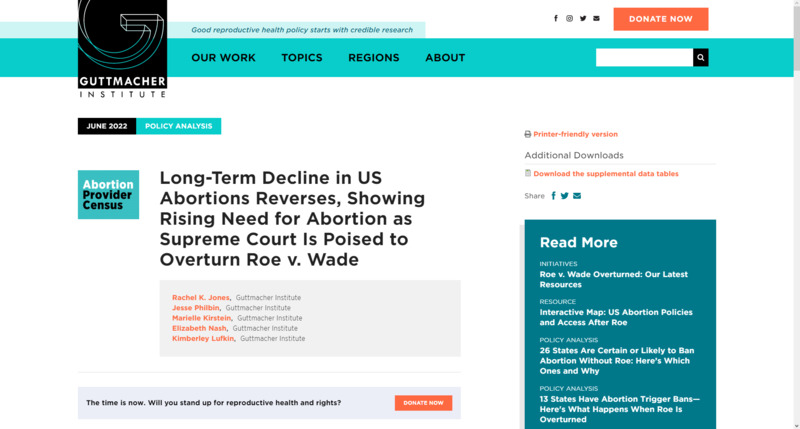
Long-Term Decline in US Abortions Reverses, Showing Rising Need for Abortion as Supreme Court Is Poised to Overturn Roe v. Wade
This is a news story from The Guttmacher Institute. This article was written before the official Supreme Court decision was released on abortion. The article states that the 30 year decline in abortions has picked up with the threat of Roe v. Wade getting overturned. At the time this article is being entered in, Roe has been officially overturned by the Supreme Court. What is more interesting to me are the numbers given on abortions in 2020, when COVID was at its peak. In 2020, there was 930,160 total abortions, which was an 8% increase from 862,320 abortions in 2017. In 2020, about 1 in 5 pregnancies ended in abortion. The increase in abortions was marked in an overall 6% decrease in births between 2017 and 2020. The article does not discuss the social reasons why more abortions were happening in 2020 compared to other years, but in my own opinion, people's fears of hospitals being too full and the financial strain of lockdowns would have made it difficult to want to carry a baby to term. At the time, people were unsure of how long lockdowns and restrictions would last, so getting the pregnancy care needed to prevent issues giving birth would have been harder to come by. -
 2022-06-17
The Pandemic ‘Baby Bust’ and Rebound
This is a news story from National Academics by Sara Frueh. It goes over the data of births throughout the pandemic. Melissa Kearney, a professor of economics at the University of Maryland, says that there was this idea at the beginning of the pandemic that it would lead to a baby boom with people being forced to stay home, but it did not. She adds that closed or limited facilities at the height of the pandemic maybe impacted some people. To support the claim, she brings up the pandemic from 1918-1919 and how that also led to decreased birth rates. An analysis of the data from Kearney states there were 62,000 fewer conceptions in the years from 2020-2021. There was a small increase in conception rates in the summer of 2020, but fell into decline again soon afterwards. The overall trend that Kearney sees with the birth and conception rates is that is has been a steady decline after COVID. -
 2022-03-16
COVID Surge in American Samoa
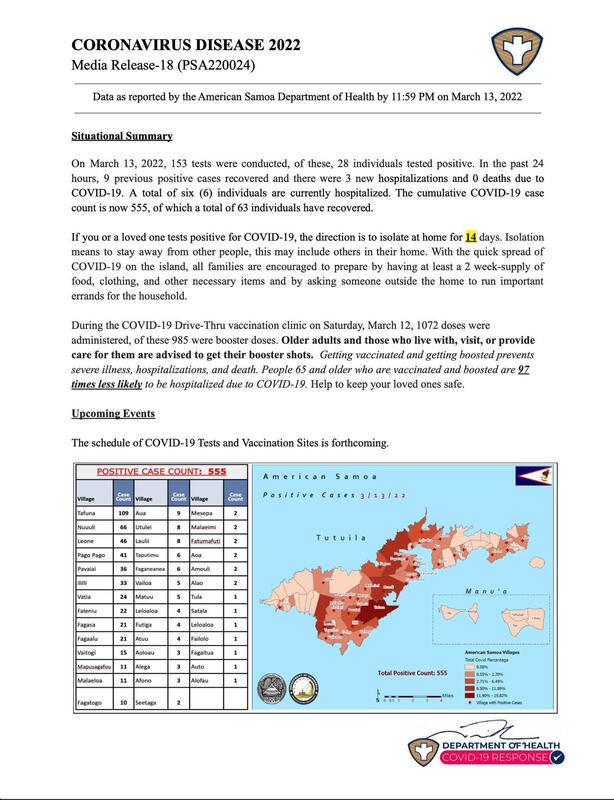
American Samoa, a small U.S territory located in the South Pacific, was the last place to experience the surging numbers of covid cases. When the coronavirus was declared a pandemic at the beginning of 2020, American Samoa was the only place on earth not to have any cases of COVID. To combat the disease, the government of American Samoa barred incoming flights for a whole year from the United States and their neighboring island of Western Samoa. Although the island did not have any COVID cases, the government promoted and maintained the restrictions throughout the island. However, after opening the borders for inbound flights after a year, American Samoa did not report its first Covid case until September 2021. Since then, travel restrictions and quarantine for travelers were enforced, but eventually, a big surge of cases began to be seen in mid-February of this year. The opening of borders to inbound flights brought the disease into the island. Coronavirus cases jumped from only a hundred to 555. It is still considered relatively low worldwide, but it is high for a small island. Fortunately, no fatalities are reported, with more than 80 percent of the population vaccinated. The attached image is data reported weekly by the American Samoa Department of Health to the public to show how many cases are positive in each village and totaled in American Samoa. The people were worried that the disease might cause some fatalities, the government was quick to impose a lockdown restriction called "CODE RED," which barred social gatherings, schools, traveling, and work on February 22. Although the public panicked with the news of coronavirus cases on the island, the government worked to assure the safety of the people by making sure people were aware of the number of cases and the situation with live news updates and weekly data by the Department of Health. I was also worried when I first heard of the surging number of COVID cases at home. Although I moved to the states for school, I made sure I am kept up to date with what is happening back at home. With the fatalities I saw here in the states with Covid, I was also worried for my parents. But it was comforting to see the live updates by the government on social media which kept me closer to home. -
 2021-08-17
Vaccine Rates and Covid in Gray's Harbor County
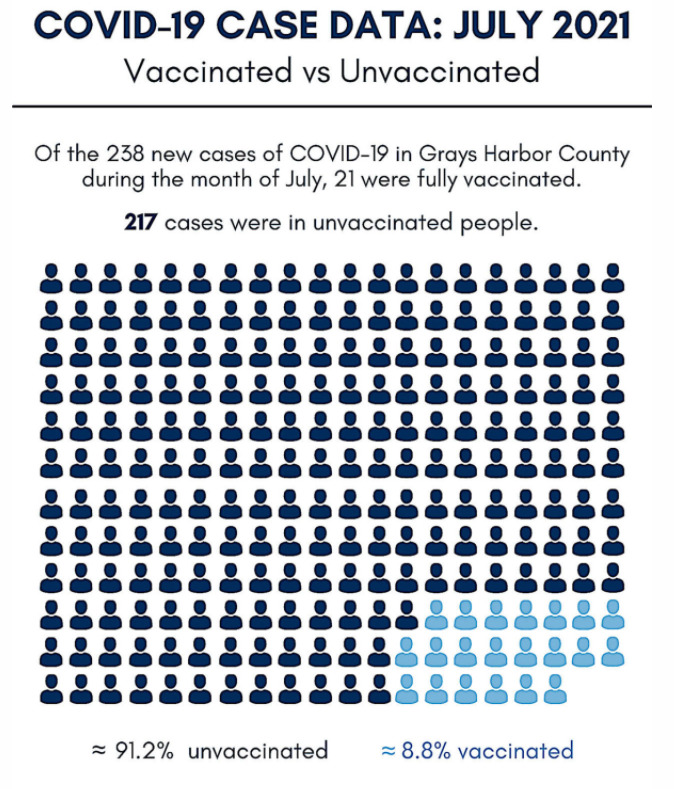
Grays Harbor County is having a Covid spike that is mainly affecting the unvaccinated population. This is adding stress to the testing facilities in the county and causing issues with hospitalizations. -
 2021-07-28
The spread of Covid-19
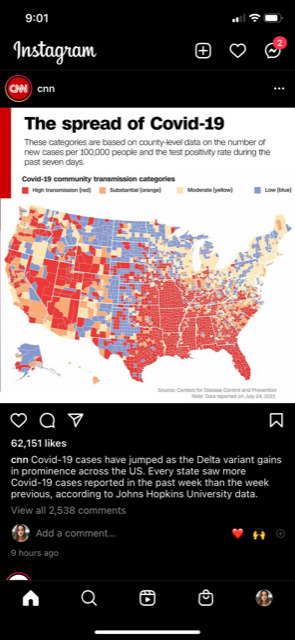
"cnn Covid-19 cases have jumped as the Delta variant gains in prominence across the US. Every state saw more Covid-19 cases reported in the past week than the week previous, according to John Hopkins University data." -
 2021-03-07
The COVID Racial Data Tracker
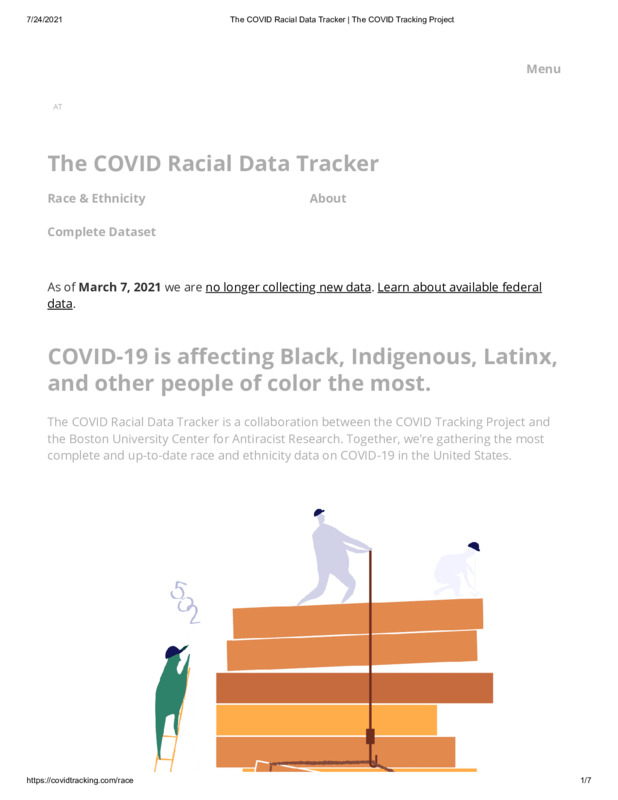
This data tracker showed how Covid-19 disproportionately affected black, Latinx, and indigenous communities. -
 2021-07-21
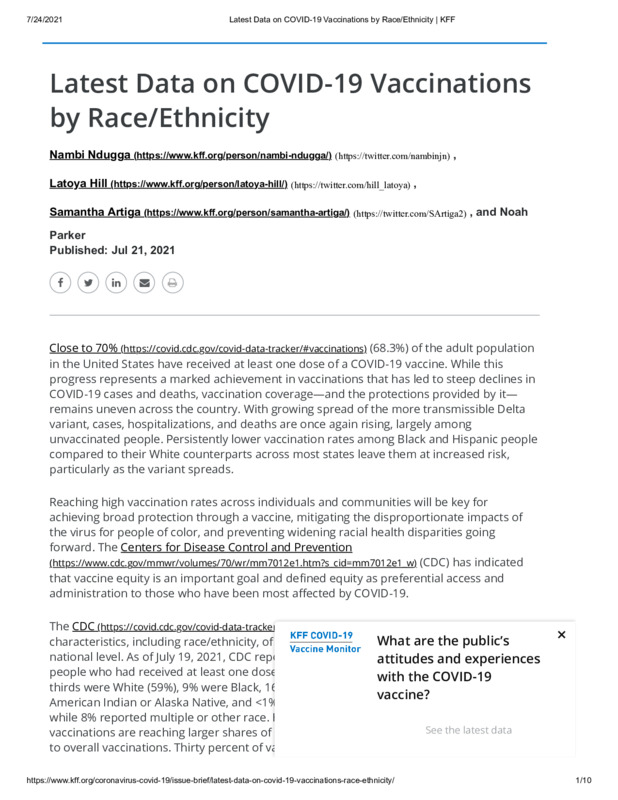
Latest Data on COVID-19 Vaccinations by Race/Ethnicity
This is an analysis of equity in vaccine distribution. The data shows a disparity between whites and Asians (whose vaccination rates were equal to or higher than their case counts) and black, Latino, Native American, and Native Hawaiians (whose vaccination rates were generally lower than their case counts). In recent weeks, however, these numbers seem to be improving. -
 2021-07-06
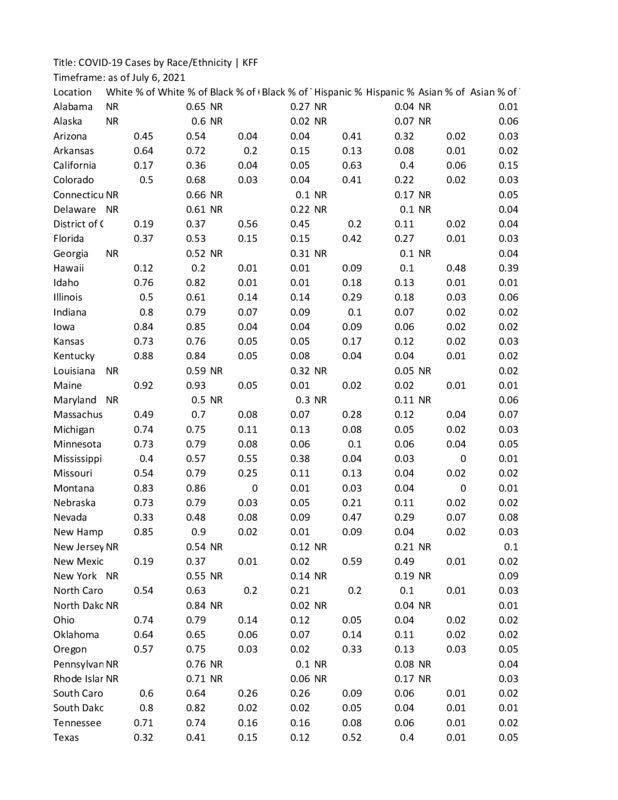
COVID-19 Cases by Race/Ethnicity
This is an interactive chart and map that allows the user to look at covid rates by race and state. -
 2021-04-19
Health Equity Considerations and Racial and Ethnic Minority Groups
The pandemic has brought the issue of health inequity in the United States, based on factors such as race and ethnicity, to the forefront. Racial and ethnic minority populations make up a disproportionate essential workers. Poverty restricts access to health care for many individuals. The country must address these issues of health equity and social justice now and continue to address it t ensure the health and safety of all those living in the United States. The website provides references, information, and data on the link between ethnicity and race and COVID-19. -
 2020
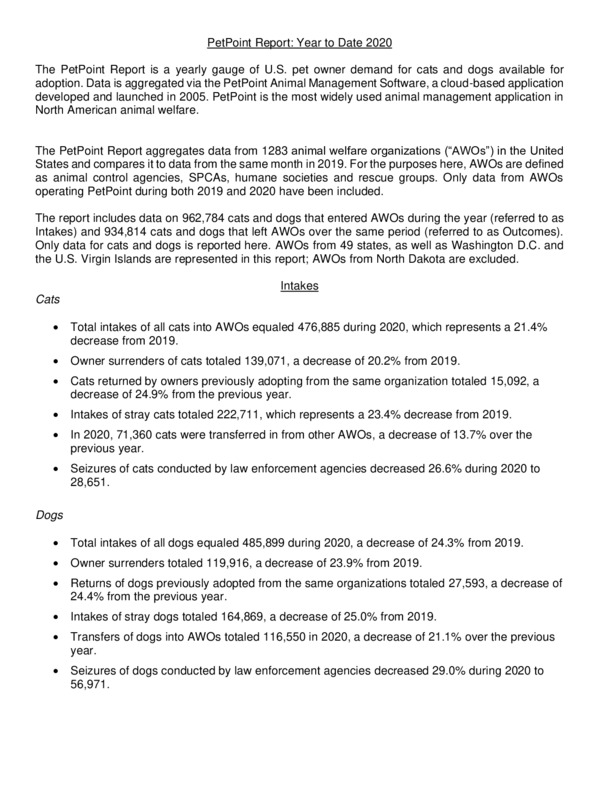
2020Pet Adoption Statistics 2020
We heard so many wonderful and uplifting stories of pet adoption during the pandemic. If you wanted a dog, particularly a puppy, you most likely had to sit on a waiting list to get one. This anecdotal evidence points toward a huge increase in pet adoption, but what do the numbers tell us? This data report from PetPoint, who has been tracking pet surrender and adoption data nationwide since 2005, paints a slightly different picture. Pet surrenders reduced significantly, so there just weren't as many pets in need of adoption. Pet adoption percentages actually decreased in 2020 from 2019. So the pet adoption boon that we imagined was happening, was not the miracle story that animal enthusiasts were hoping for. As we emerge from the pandemic it will be interesting to look at the final report at the end of 2021 to see if there is a drastic increase in surrenders as many shelters are anticipating. -
 2021-04-02
Strength and Innovation of Indigenous Communities During the Pandemic
This article demonstrates that despite the inequities faced by Native Americans and indigenous populations they have been innovative in combatting the pandemic and shown strength in the face of fear, illness, and uncertainty. -
 2021-04-20
Images and Audio from "Arizona's COVID-19 Pandemics" Exhibit
During March and April 2021, I created an online exhibit from content within Arizona State University's "A Journal of the Plague Year" COVID-19 archive. Entitled "Arizona's COVID-19 Pandemics," the digital exhibit contained images previously submitted to the archive, along with several copyright-free images I found on pexels.com. I have attached all these images. Listed by their order of appearance within the exhibit, their sources are as follows: 1- "Face It" Campaign flyer: Coconino County Health & Human Services ( https://covid-19archive.org/s/archive/item/42998 ) 2- Red Rocks, Sedona: Courtesy of Gregory Whitcoe via Pexels.com 3- Online Learning: Courtesy of August de Richelieu via Pexels.com 4- Tséhootsooí Medical Center staff: Courtesy of FDIHB Marketing Department and Navajo Times newspaper ( https://covid-19archive.org/s/archive/item/41189 ) 5- Arizona's Mask Mandate Map: created by Sarandon Raboin ( https://covid-19archive.org/s/archive/item/26267 ) 6- Arizona COVID-19 Infection Zip Code Map: Courtesy of Arizona Department of Health Services ( https://covid-19archive.org/s/archive/item/42035 ) 7- Woman Shopping: Courtesy of Anna Shvets via Pexels.com 8- Woman on Rural Arizona Road: Courtesy of Taryn Elliot via Pexels.com 9- Masked Woman in Crowd: Courtesy of Redrecords via Pexels.com 10- The Wave: Courtesy of Flickr via Pexels.com (this image is found only in the PDF submission of the exhibit, not in the public-facing exhibit itself due to document formatting technicalities - the PDF version can be found at https://covid-19archive.org/s/archive/item/42998 ) -
 2021-04-19
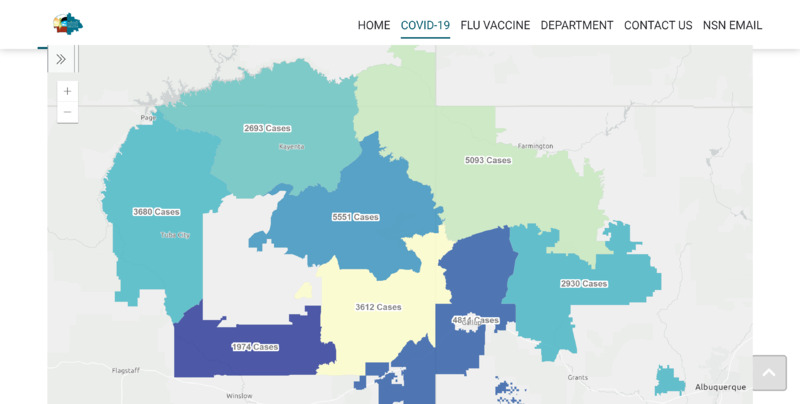
Navajo Department of Health COVID-19 Case Infection Data by Region through 19 April 2021
This image, taken as a screenshot from the Navajo Department of Health website on 19 April 2021, shows COVID-19 infection case data by region within the Navajo Nation. -
 2021-04-19
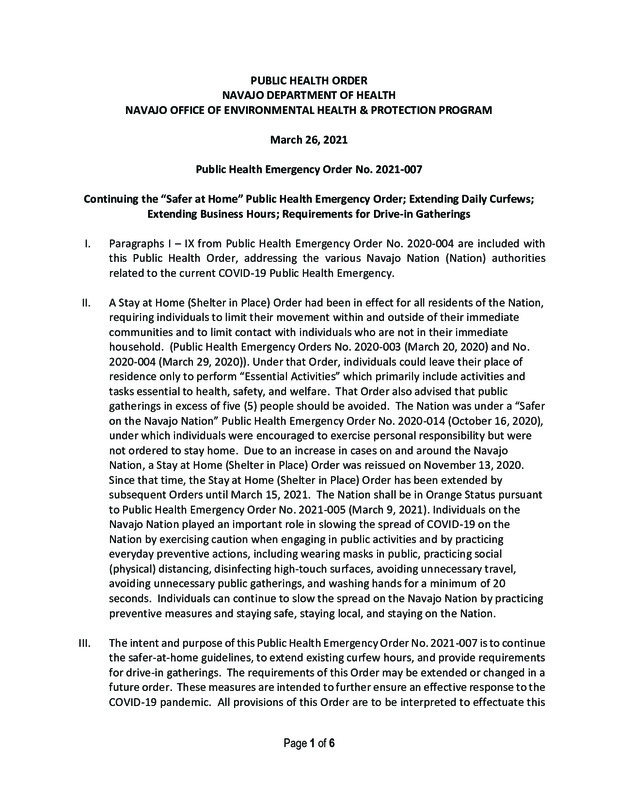
Navajo Department of Health Public Health Emergency Orders through 19 April 2021
These eight documents are the eight Public Health Emergency Orders issued by the Navajo Department of Health issued through 19 April 2021. -
 2021-04-19
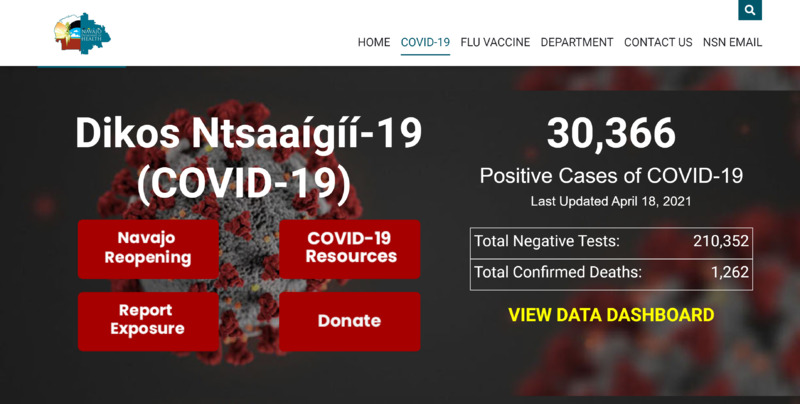
Navajo Department of Health Data & Website
Despite recent data and statistical successes, the NDOH has left its 10pm to 5am curfew in place. The site offers a dashboard with current COVID-19 information, in terms of both resources and data. -
 2020
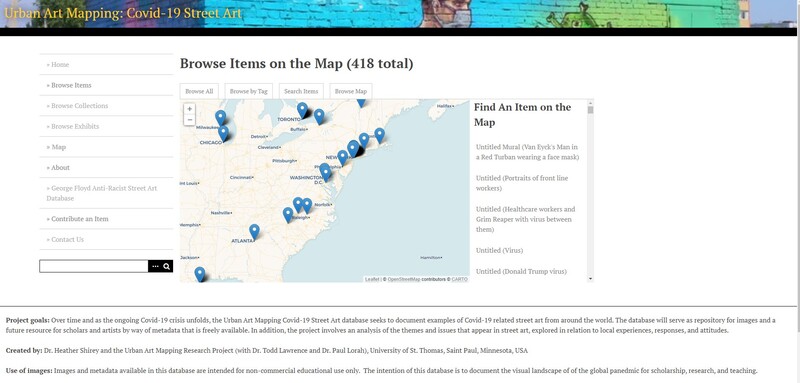
2020Pandemic Street Art: mapping and archiving street art with the University of St. Thomas
This is an archive project created by Dr. Heather Shirey and the Urban Art Mapping Research Project (with Dr. Todd Lawrence and Dr. Paul Lorah), University of St. Thomas, Saint Paul, Minnesota, USA "MAPPING COVID-19 STREET ART: Artists and writers producing work in the streets – including tags, graffiti, murals, stickers, and other installations on walls, pavement, and signs – are in a unique position to respond quickly and effectively in a moment of crisis. Street art’s ephemeral nature serves to reveal very immediate and sometimes fleeting responses, often in a manner that can be raw and direct. At the same time, in the context of a crisis, street art also has the potential to transform urban space and foster a sustained political dialogue, reaching a wide audience, particularly when museums and galleries are shuttered. For all of these reasons, it is not surprising to see an explosion of street art around the world created in response to the Covid-19 global pandemic, even as our movement in public spaces is limited due to public health concerns." -
 2021-04-14
News Article: Daily COVID-19 Updates for AZ and Counties - 04/14/2021
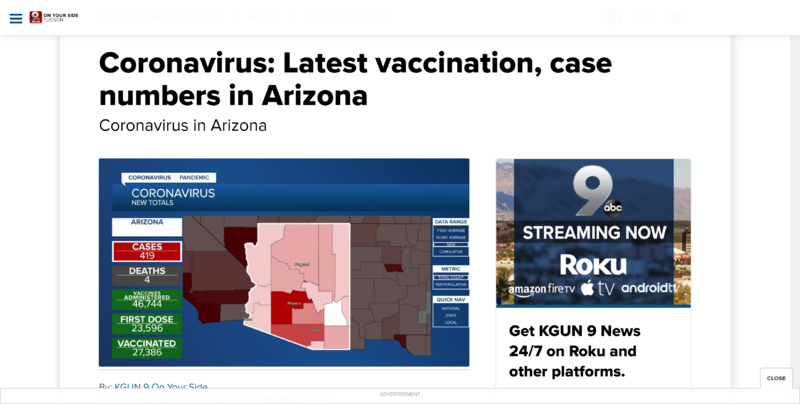
Coronavirus in Arizona with Emphasis on local Pima County data: By: KGUN 9 On Your Side - Posted at 11:36 AM, Mar 21, 2020 and last updated 9:03 AM, Apr 14, 2021 TUCSON, Ariz. (KGUN) — Editor's note: This article was first published on March 21, 2020. It is updated daily and refreshed with the latest updates and cases throughout Arizona. Arizona Public Health officials are tracking the spread of coronavirus throughout the state. Here are the latest numbers provided by the Arizona Department of Health Services. Last updated on April 14, 2021 FULL SECTION: CORONAVIRUS IN ARIZONA Vaccinations in Arizona: New doses reported today: 46,744 Total doses administered: 4,213,938 Total number of people who have received at least 1 dose: 2,611,983 Total number of people who have received 2 doses: 1,745,928 Percent of population vaccinated: 36.3% Vaccinations in Pima County: New doses reported today: 9,029 Total doses administered: 578,853 Total number of people who have received at least 1 dose: 363,431 Total number of people who have received 2 doses: 242,638 Percent of population vaccinated: 34.8% Cases and Deaths through 04/14/2021: Number of deaths: 17,109 Number of cases: 851,265 New cases: 419 New deaths: 4 Total number of tests reported: 8,835,798 (Diagnostic and Serology) New tests reported: 17,381 Reported cases of COVID-19 by county: Maricopa: 529,471 Pima: 113,903 Pinal: 50,417 Navajo: 16,018 Coconino: 17,398 Yavapai: 18,642 Cochise: 11,769 Graham: 5,520 Santa Cruz: 7,882 Yuma: 36,943 Apache: 11,256 Mohave: 22,353 La Paz: 2,450 Gila: 6,855 Greenlee: 568 Breakdown of cases in Pima County: Total cases: 113,903 Deaths: 2,372 New cases: 81 New deaths: -1 -
 2021-04-14
News Article: Navajo Nation reports no COVID-19 deaths for 3rd day in row
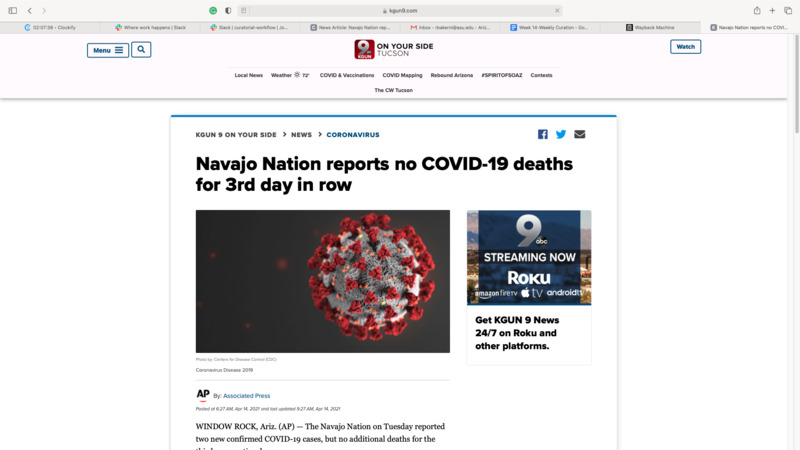
Despite very grim months through the last year's COVID-19 pandemic in the Navajo Nation, the Associated Press reported continuing indications of success for the Navajo people and their rural communities: WINDOW ROCK, Ariz. (AP) — The Navajo Nation on Tuesday reported two new confirmed COVID-19 cases, but no additional deaths for the third consecutive day. The latest numbers brought the pandemic totals on the tribe’s reservation to 30,269 cases and 1,262 known deaths. Tribal officials had ordered a lockdown last weekend over fears that a new variant could drive another deadly surge. The Stay-At-Home order required all Navajo Nation residents to refrain from unnecessary travel to help limit the spread of the virus, including a new and more contagious strain. Navajo Nation President Jonathan Nez recently announced the first confirmed case of the COVID-19 B.1.429 variant on the reservation that covers parts of Arizona, New Mexico and Utah. -
 2020
2020Sistema de monitoreo territorial
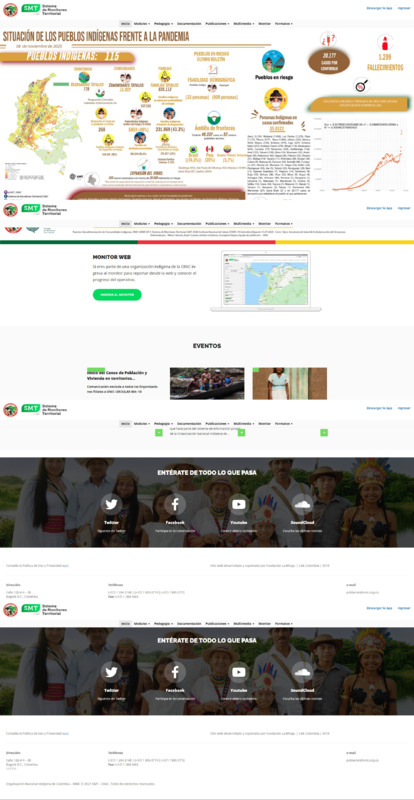
"El Sistema de Monitoreo Territorial es una plataforma de recolección y generación de información que hace parte del sistema de información propio de la Organización Nacional Indígena de Colombia." "The Territorial Monitoring System is a platform for collecting and generating information that is part of the information system of the National Indigenous Organization of Colombia" -
 2021-04-07
Indian Health Services COVID-19 Infections by Service Area through 04/07/2021
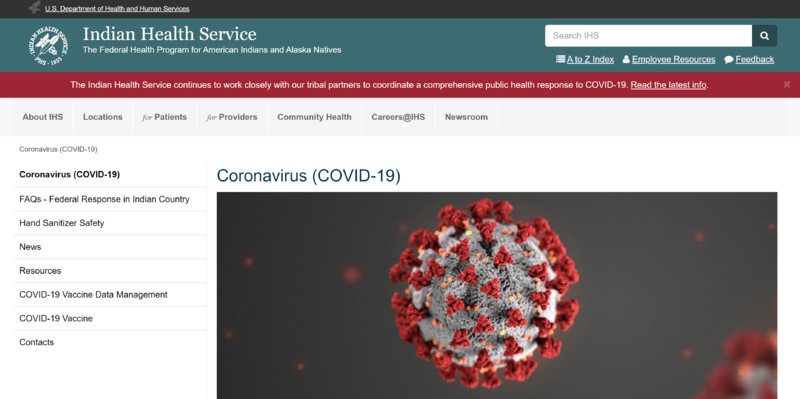
Indian Health Services is an agency of the United States federal government that oversees and administers healthcare to that nation's Native American populations and tribal reservations. This webpage from the Indian Health Services has three sections that address general Coronavirus (COVID-19) information and links, COVID-19 Vaccine Distribution and Administration by IHS Area, and COVID-19 Cases by IHS Area. it also includes a hyperlink to an interactive map for up-to-date COVID-19 Cases by IHS Area: https://maps.ihs.gov/portal/apps/StoryMapBasic/index.html -
 2021-04-08
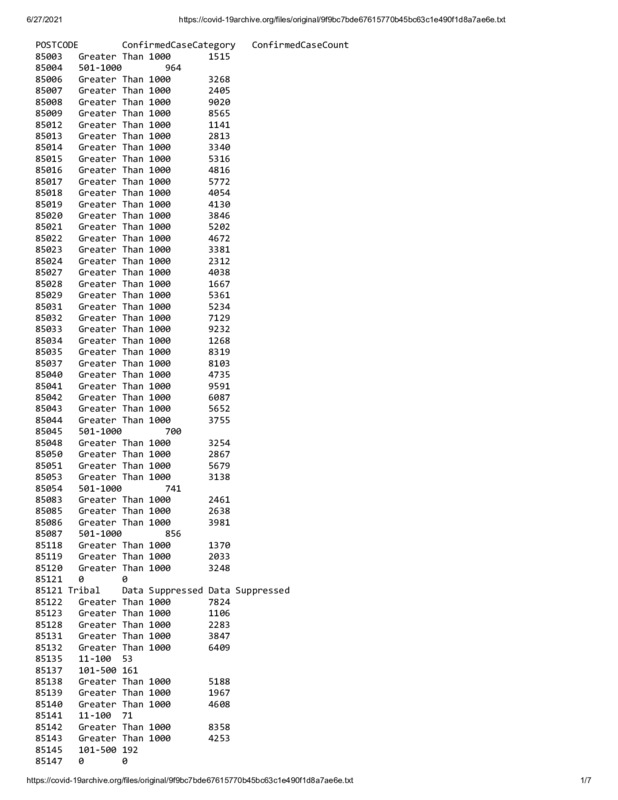
Arizona COVID-19 Infections by Zip Code through 04/08/2021
This text file shows data from the Arizona Department of Health Services for confirmed COVID-19 infections tied to the patient's residential zip code. The data runs through 04/08/2021 and can be searched by "Ctrl + F" and entering specific zip codes. AZDHS suppressed tribal data from this data file prior to its publication on the organization's website. -
 2021-04-06
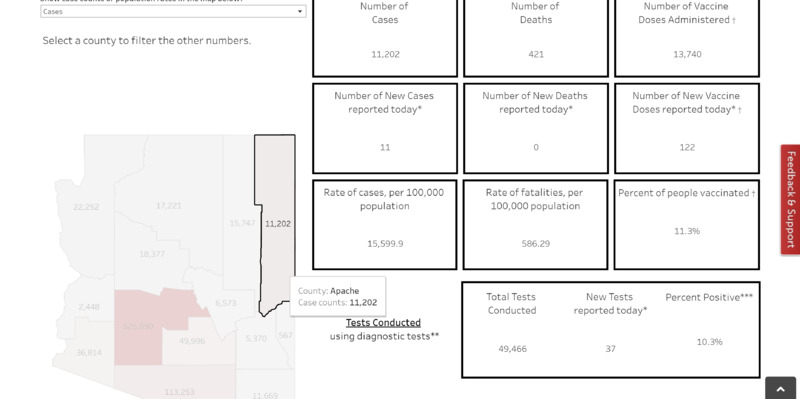
Arizona Department of Health Services County-Specific Data through 04/06/2021
These screenshots show COVID-19 data from the Arizona Department of Health Services for each of Arizona's 15 counties and their cumulative state-wide total. The counties' respective case rate and death rate data are expressed as a percentage of their population and further demonstrate the dichotomies between pandemic experience by residential locale: Arizona statewide: 11.77% population infection rate (0.236% population fatality rate) Greenlee County: 5.47% (0.096%) Yavapai County: 7.91% (0.210%) Cochise County: 8.92% (0.214%) Mohave County: 10.26% (0.318%) Pima County: 10.84% (0.226%) Pinal County: 10.93% (0.188%) La Paz County: 11.08% (0.353%) Coconino County: 11.69% (0.221%) Gila County: 11.92% (0.402%) Maricopa County: 12.06% (0.222%) Graham County: 13.95% (0.200%) Navajo County: 13.96% (0.462%) Santa Cruz County: 14.77% (0.325%) Apache County: 15.60% (0.586%) Yuma County: 16.01% (0.357%) -
 2020
2020Cultural Survival: disaggregation of data of, for, and by Indigenous Peoples
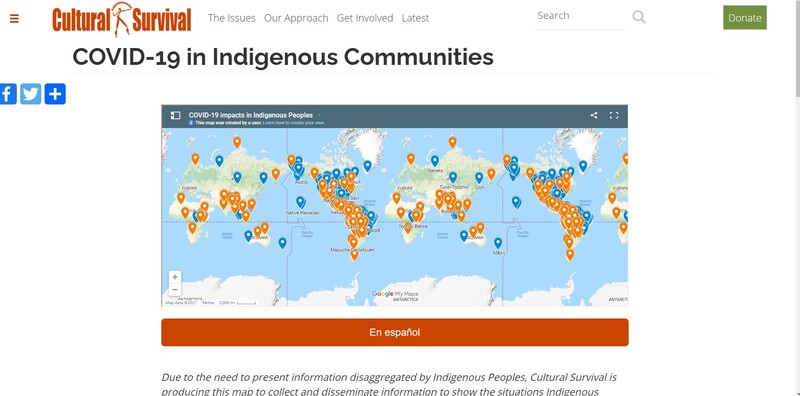
"Due to the need to present information disaggregated by Indigenous Peoples, Cultural Survival is producing this map to collect and disseminate information to show the situations Indigenous communities are facing as a result of COVID-19. As the number of cases increase daily, and the lack of access to testing in rural areas, the data presented here will evolve over time. Empty areas do not imply that there are no cases of COVID-19 or human right violations. This is a continuous and not exhaustive effort and we invite Indigenous Peoples and their communities to contribute. [...] Our COVID-19 response features a holistic, multi-layered approach including curating a global monitoring system for COVID-19 for Indigenous communities using Google maps technology to document COVID-19 cases and related human rights violations." -
 2021-04-06
Gila County Health Department and COVID-19
The Gila County webpage provides clear and concise information for residents on COVID-19 updates, as well as specific data to allow residents who wish to be vaccinated to choose which manufacturer's product they receive. This is unlike any of the major Arizona county sites, or even the state's site, as they do not allow residents to differentiate between the vaccines. Additionally, the information displayed here demonstrates how far ahead rural Gila County is in achieving President Joseph R. Biden's directive to allow all adults in America access to vaccines by April 19. -
 2021-04-01
News Article: How AI Played a Role in Pfizer’s Covid-19 Vaccine Rollout
This Wall Street Journal PRO article on Pfizer's use of artificial intelligence discusses that company's use of predictive technologies to identify geographic areas with the greatest potential for its COVID-19 vaccine clinical trials. -
 2021-04-06
News Article: Pfizer Injects AI Into Vaccine Trials
This sub-article was the lead item in this week's Wall Street Journal PRO "Artificial Intelligence Weekly" email blast: "By Angus Loten Welcome back. Artificial intelligence is set to take a decisive role in shaping the post-pandemic economy, from helping employers reopen workplaces to getting supply chains back on track. Corporate technology leaders and industry analysts offered these and other insights at last week’s virtual edition of the WSJ Pro AI Executive Forum. Some of their views are outlined in the sections below. One broad takeaway: Though still in its infancy, AI is already having a profound impact on our daily lives. Pfizer’s Speedy Vaccine Rollout Pfizer Inc. last year developed AI-powered dashboards designed to monitor the effect of Covid-19 on clinical trials in real time, ultimately helping the pharmaceutical giant roll out its coronavirus vaccination in less than a year, The Wall Street Journal’s Sara Castellanos reports. A shot in the arm. Pfizer fed large amounts of case-rate data into AI-enabled predictive models to quickly generate site selection for clinical trials, said Lidia Fonseca, the company’s chief digital and technology officer. A smart move. Pfizer two years ago began experimenting with the emerging technologies, focusing on digital tools that promised to offer better outcomes for patients, doctors and employees, with results it was able to draw on during the pandemic, Ms. Fonseca said." -
 2021-03-25
News Article: Graham County (AZ) now with less than 150 active documented COVID-19 cases
"By Jon Johnson, jonjohnsonnews@gmail.com SAFFORD – Graham County has had very few new confirmed cases of COVID-19 in the past month, lowering its numbers to just 147 active cases as of Thursday. According to the Graham County Department of Health and Human Services, Graham County has had a total of 5,355 confirmed cases for the course of the pandemic, with 5,132 listed as being recovered, 147 active, and 76 deaths in more than a year. No new cases were recorded Thursday, and, according to the Arizona Department of Health Services COVID-19 school dashboard, Graham County had just a 1 percent positivity rate as of the week of March 14. That is good for a tie with Apache County for the second-lowest percent positivity rate out of Arizona’s 15 counties. Only Greenlee County, which registered a zero percent positivity rate from Feb. 27 – March 14, had lower. With the lower cases statewide and vaccine rollout, Governor Doug Ducey issued an Executive Order on Thursday, rolling back several COVID-19 mitigation measures involving businesses and gatherings. This comes as other states roll back their COVID-19 mitigation measures as well. The rollout of the various COVID-19 vaccines has picked up steam in the last month, with the state opening up the vaccine to anyone 16 years old or older for the Pfizer vaccine. Anyone 18 years old or older can be administered the Moderna and Johnson & Johnson vaccines. The San Carlos Apache Healthcare Corporation is holding a free, drive-through vaccine clinic on Saturday, March 27 at the San Carlos High School. No appointment is necessary. The clinic will be administering both the Pfizer and Moderna vaccines. Graham County and Greenlee County are also providing vaccination sites for those 18 and older, and provide the Moderna and Johnson & Johnson vaccines. Greenlee County: According to the Greenlee County Health Department, the county currently has just nine active cases of COVID-19. For the course of the pandemic, Greenlee County has had 568 confirmed positive cases (by far the lowest out of any of Arizona’s 15 counties), with 549 recovered cases, nine active, and 10 deaths." -
 2021-03-30
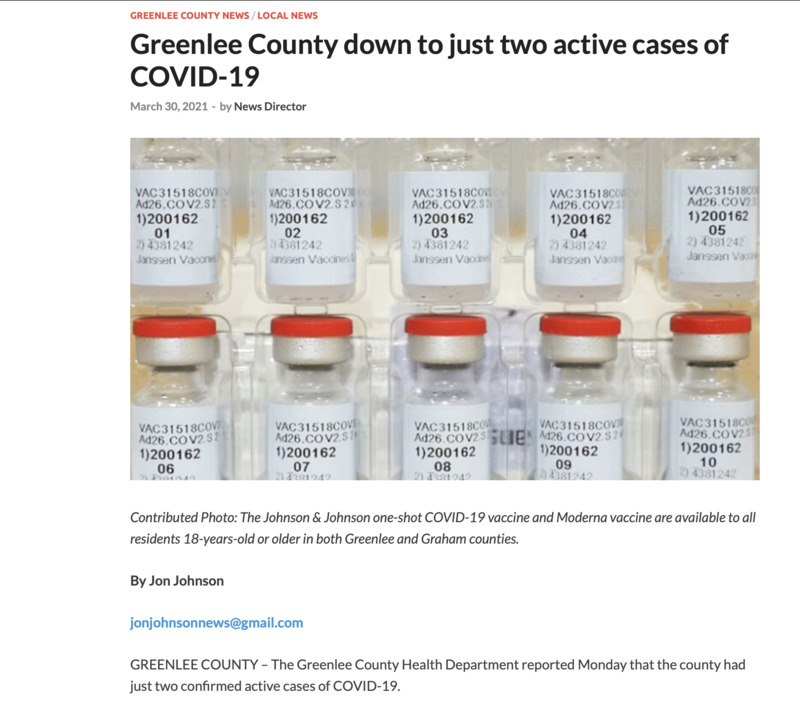
News Article: Greenlee County (AZ) down to just 2 active COVID-19 cases
"By Jon Johnson, jonjohnsonnews@gmail.com GREENLEE COUNTY – The Greenlee County Health Department reported Monday that the county had just two confirmed active cases of COVID-19. Greenlee County has tested more than 5,000 people for the course of the pandemic and has had a total of 568 cases, with 556 recovered and 10 deaths. The county offers the Moderna COVID-19 vaccine to all residents 18-years-old or older, and on Thursday (01-April-2021) Gila Health Resources will have a vaccine clinic for the one-shot Johnson and Johnson COVID-19 vaccine. Click here to learn more or to register. According to the Arizona Department of Health Services, 37.5 percent of Greenlee County’s residents have been vaccinated for COVID-19. That is the highest percentage out of Arizona’s 15 counties. Conversely, Graham County is listed as having just 18.1 percent of its population vaccinated, which is the third-worst out of Arizona’s counties behind Maricopa County at 17.5 percent and Apache County at 10.7 percent. Graham County: The Graham County Department of Health and Human Services reported three new confirmed positive tests for COVID-19 on Tuesday. While Graham County has had 5,364 total confirmed cases of COVID-19, as of Tuesday the county had just 138 confirmed active cases. Out of all its confirmed cases, 5,150 are listed as being recovered, and 76 have died. Graham County is also offering both the Moderna and Johnson & Johnson vaccines to all residents 18-years-old or older. Click here for more information." -
 2021-04-05
Greenlee County (AZ) Health Department's Daily COVID-19 Updates through April 5, 2021
The Greenlee County Health Department uses its Facebook page to disseminate daily information related to the COVID-19 pandemic to its residents. The daily COVID-19 statistics are displayed as an image on the daily Facebook post, which allows examination of the department's content and messaging before and after the pandemic. Governor Doug Ducey declared a state of emergency in Arizona on March 11, 2020, which seems inconsistent with GCHD's daily posts from that period. Language on the GCHD posts consistently advised residents to stay home if they felt ill, rather than being consistent with Governor Ducey's voluntary Stay Home orders. For example, the March 30, 2021, press release to update a new active COVID-19 infection in Greenlee County reads as follows: "For Immediate Release, Tuesday, March 30, 2021, Greenlee County, Arizona. Public Information Contact: Steve Rutherford (928) 865-2601 NEW RELEASE - COVID-19 Positive Test in Greenlee County The Greenlee County Health Department is investigating one (1) new confirmed case of COVID-19. The case will put our current total at five hundred and sixty-nine (569) confirmed Greenlee County COVID-19 cases... We would like to remind the community to use masks appropriately when outside of the home, practice social distancing, wash your hands frequently, and do not go into the public when you are feeling sick, unless you are seeking medical attention." These updates demonstrate a significant dichotomy between the rural and urban experiences during this pandemic. -
 2021-03-30
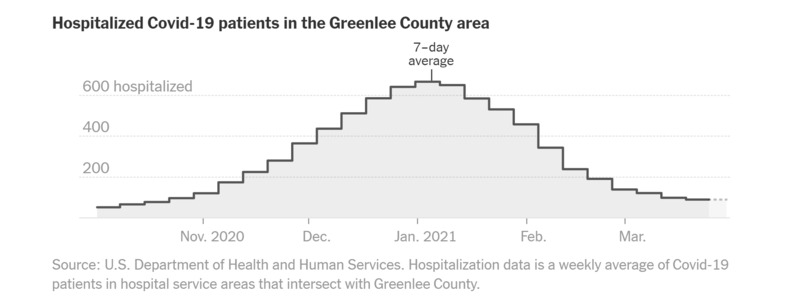
A Tale of Two Arizonas: COVID-19 Data from Maricopa and Greenlee Counties Through March 30, 2021
This daily tracker displayed on the New York Times site displays and explains public data provided by the Arizona Department of Health Services. The attached graphs illustrate the disparate COVID-19 experience between Arizona residents in Maricopa County and Greenlee County. Arizona is the sixth largest of the United States with a population of more than seven million residents within its 113,594.08 square miles. 61% of Arizonans reside in Maricopa County, which translates to a population density of approximately 481.3 people per square mile, or 57,959.3 square feet per resident. In contrast, southeastern Arizona’s Greenlee County claims only 0.14% of the state’s residents for a population density of 5.7, or approximately 4.8M square feet per person. -
 2021-03-30
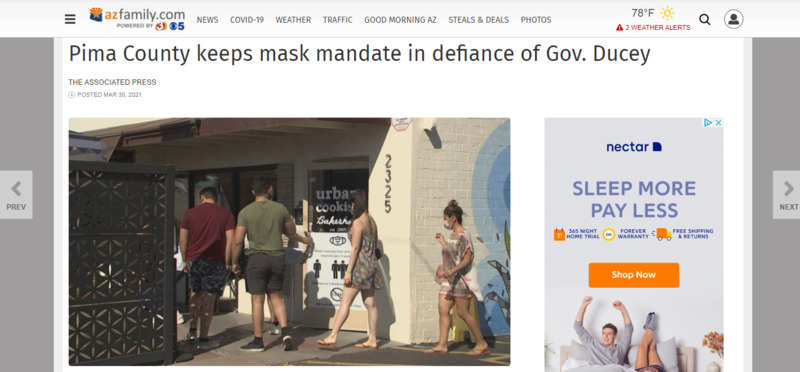
News Article: Pima County keeps mask mandate in defiance of Gov. Ducey
This article from the Associated Press relays the arguments Pima County officials have made in keeping mask mandates in place despite recent orders from Governor Doug Ducey on 25-March-2021 that prohibit new mask requirements and phase out current restrictions previously issued by local governments across Arizona. -
 2020-10-13
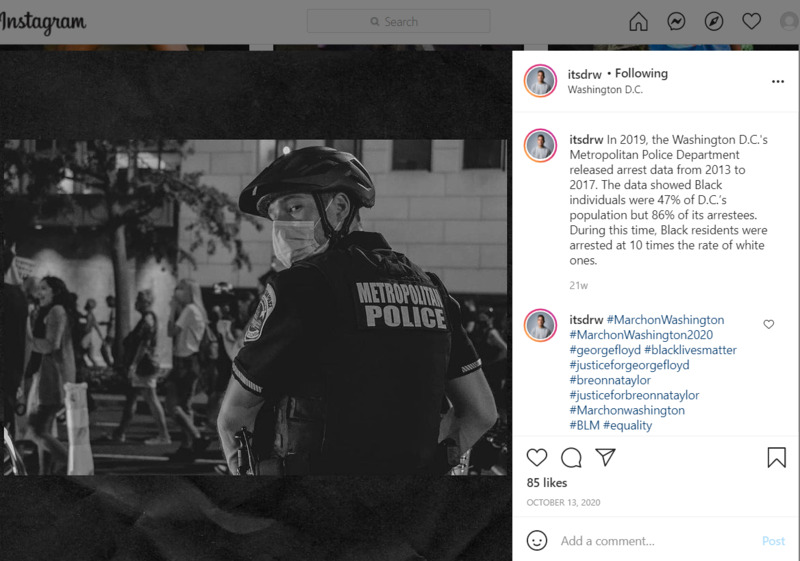
Statistics and Data
In 2019, the Washington D.C.'s Metropolitan Police Department released arrest data from 2013 to 2017. The data showed Black individuals were 47% of D.C.’s population but 86% of its arrestees. During this time, Black residents were arrested at 10 times the rate of white ones. -
 2020-10-13
COVID-19 data diggers — and doubters — call for clearer picture in B.C.
There's a growing push for B.C. to collect and share more detailed data about COVID-19 positive hotspots. Last week, hundreds of parents called on the provincial health officer to divulge more data so that people can make informed decisions as a new wave of infections hits the province. This week, epidemiologists, data analysts and former federal health minister and Toronto doctor Jane Philpott called for "radical transparency" around Canadian COVID data. -
 2020-09-04
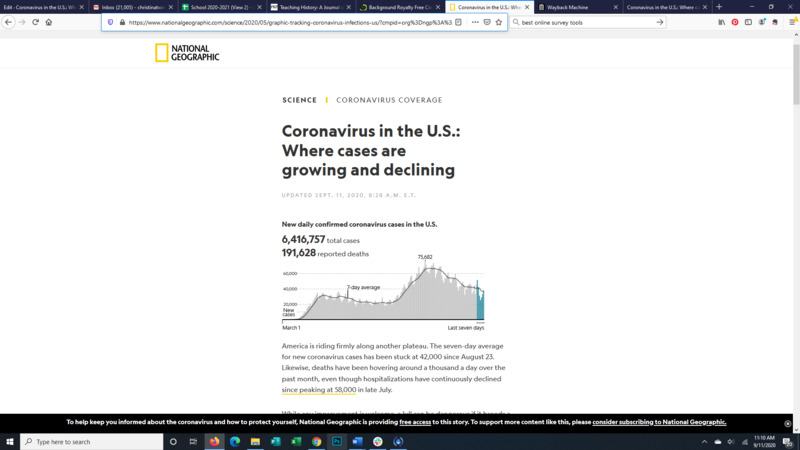
Coronavirus in the U.S.: Where cases are growing and declining
This article was published by National Geographic and made public by them to help spread awareness of the current state of the Coronavirus epidemic. This article is important because often information is gained second or third hand from someone who heard from someone who heard from someone else and by the time the information gets to you, the actual info is lost. National Geographic has long been known as a reputable source of information and so the information from them can usually be counted on to be accurate. Having an accurate source of information can help ease anxiety people may have simply from 'not knowing.' This article stated that, in the US, cases have been steady but with the cooler temperatures coming, may rise again as more people are spending their time primarily indoors. This article serves as a good snapshot of the current state of things in the coronavirus universe in September 2020. -
 2020-05-31
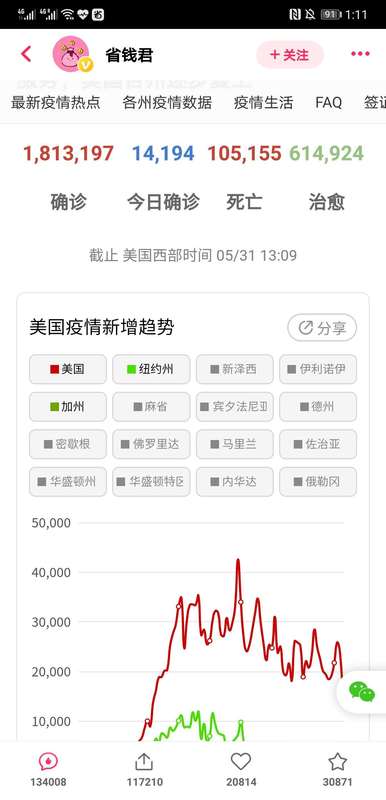
Death people everyday
It has been three months since the COV-19 appears and death per day and infect people are still increasing as usual more than 20K every day.
