Items
Creator is exactly
Arizona Department of Health Services
-
 2021-04-20
Images and Audio from "Arizona's COVID-19 Pandemics" Exhibit
During March and April 2021, I created an online exhibit from content within Arizona State University's "A Journal of the Plague Year" COVID-19 archive. Entitled "Arizona's COVID-19 Pandemics," the digital exhibit contained images previously submitted to the archive, along with several copyright-free images I found on pexels.com. I have attached all these images. Listed by their order of appearance within the exhibit, their sources are as follows: 1- "Face It" Campaign flyer: Coconino County Health & Human Services ( https://covid-19archive.org/s/archive/item/42998 ) 2- Red Rocks, Sedona: Courtesy of Gregory Whitcoe via Pexels.com 3- Online Learning: Courtesy of August de Richelieu via Pexels.com 4- Tséhootsooí Medical Center staff: Courtesy of FDIHB Marketing Department and Navajo Times newspaper ( https://covid-19archive.org/s/archive/item/41189 ) 5- Arizona's Mask Mandate Map: created by Sarandon Raboin ( https://covid-19archive.org/s/archive/item/26267 ) 6- Arizona COVID-19 Infection Zip Code Map: Courtesy of Arizona Department of Health Services ( https://covid-19archive.org/s/archive/item/42035 ) 7- Woman Shopping: Courtesy of Anna Shvets via Pexels.com 8- Woman on Rural Arizona Road: Courtesy of Taryn Elliot via Pexels.com 9- Masked Woman in Crowd: Courtesy of Redrecords via Pexels.com 10- The Wave: Courtesy of Flickr via Pexels.com (this image is found only in the PDF submission of the exhibit, not in the public-facing exhibit itself due to document formatting technicalities - the PDF version can be found at https://covid-19archive.org/s/archive/item/42998 ) -
 2021-04-08
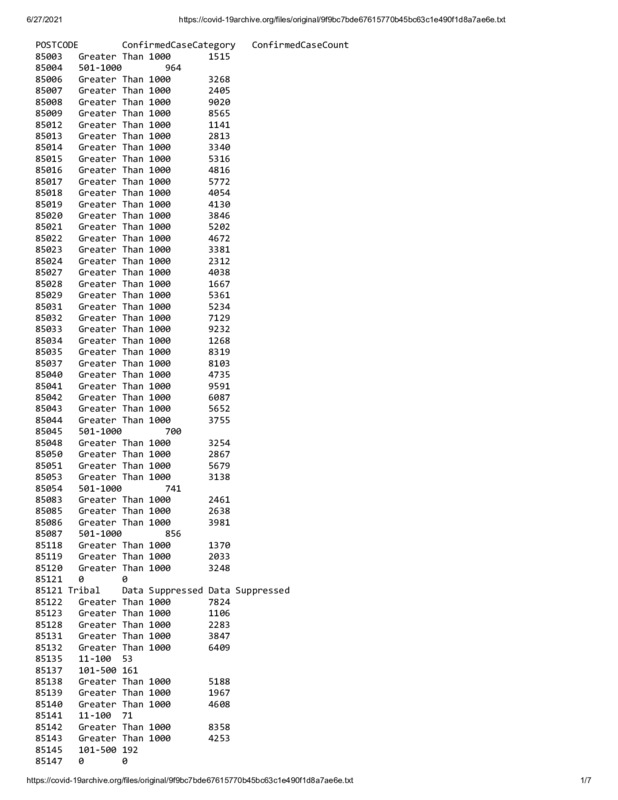
Arizona COVID-19 Infections by Zip Code through 04/08/2021
This text file shows data from the Arizona Department of Health Services for confirmed COVID-19 infections tied to the patient's residential zip code. The data runs through 04/08/2021 and can be searched by "Ctrl + F" and entering specific zip codes. AZDHS suppressed tribal data from this data file prior to its publication on the organization's website. -
 2021-04-06
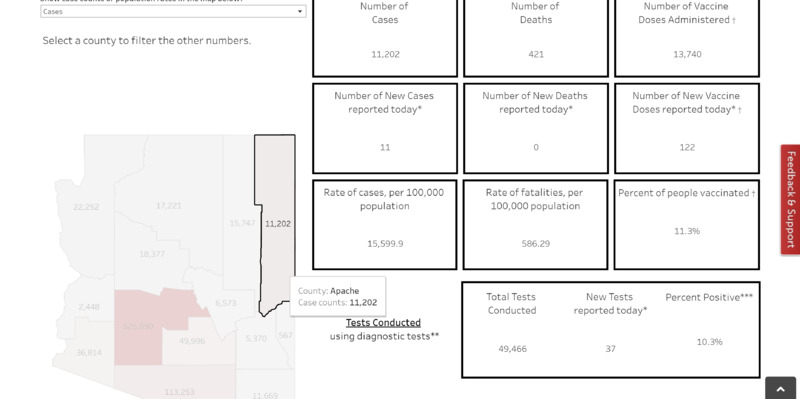
Arizona Department of Health Services County-Specific Data through 04/06/2021
These screenshots show COVID-19 data from the Arizona Department of Health Services for each of Arizona's 15 counties and their cumulative state-wide total. The counties' respective case rate and death rate data are expressed as a percentage of their population and further demonstrate the dichotomies between pandemic experience by residential locale: Arizona statewide: 11.77% population infection rate (0.236% population fatality rate) Greenlee County: 5.47% (0.096%) Yavapai County: 7.91% (0.210%) Cochise County: 8.92% (0.214%) Mohave County: 10.26% (0.318%) Pima County: 10.84% (0.226%) Pinal County: 10.93% (0.188%) La Paz County: 11.08% (0.353%) Coconino County: 11.69% (0.221%) Gila County: 11.92% (0.402%) Maricopa County: 12.06% (0.222%) Graham County: 13.95% (0.200%) Navajo County: 13.96% (0.462%) Santa Cruz County: 14.77% (0.325%) Apache County: 15.60% (0.586%) Yuma County: 16.01% (0.357%) -
 2020-05-22
AZ Dept. of Health Guidance for Graduations
Guidelines issued by the Arizona Department of Public Health to school districts concerning graduation ceremonies. ADHS did not recommend holding ceremonies, but if districts decided to they should follow the guidelines. CCUSD held 11 smaller ceremonies and followed all CDC, ADHS and their insurance carriers recommended safety guidelines. Guidelines outlined by the CDC were part of the recommendation.