Items
Creator is exactly
Hurubie Meko
-
 2020-04-02
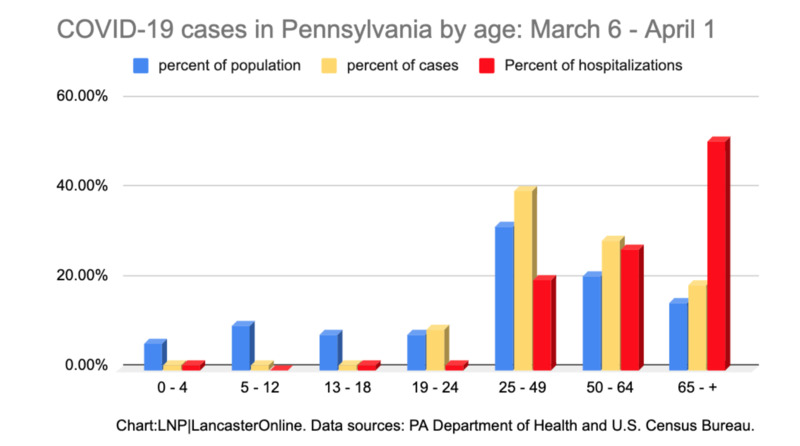
Pennsylvania COVID-19 Cases Graph
Graph shows the percent of population in blue, percent of cases in yellow, and percent of hospitalizations in red for cases in Pennsylvania. All the bars from ages 0-24 are quite low in all three categories. However from ages 25-65+ increase in all categories. The percent of hospitalizations rises drastically for ages 50-65+. While their percent of population and percent of cases are low they are the age group more likely to need hospitalization.