Items
Tag is exactly
graph
-
 2021-04-15
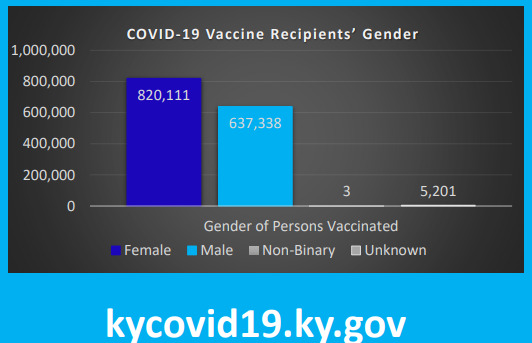
Kentucky Vaccination Statistics
Congratulations to the 3 nonbinary people in Kentucky who were vaccinated, however, I believe there could be more as some people might be afraid to select that box or don't know what to select as their gender as many queer people like I do when it comes to medical records as there is a small fear of the worry of facing discrimination in the healthcare field. This graph is both funny and a sign of a sad current present for queer and gender non-conforming people. -
 2021-03-30
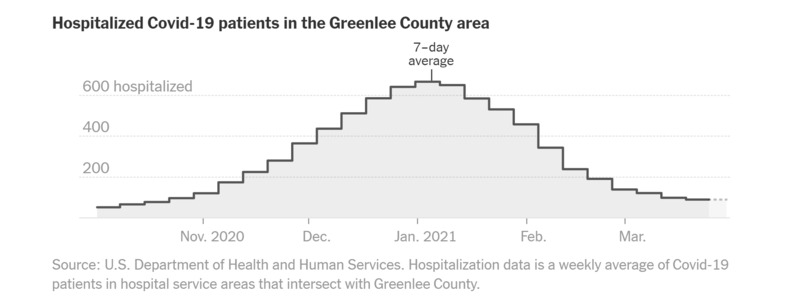
A Tale of Two Arizonas: COVID-19 Data from Maricopa and Greenlee Counties Through March 30, 2021
This daily tracker displayed on the New York Times site displays and explains public data provided by the Arizona Department of Health Services. The attached graphs illustrate the disparate COVID-19 experience between Arizona residents in Maricopa County and Greenlee County. Arizona is the sixth largest of the United States with a population of more than seven million residents within its 113,594.08 square miles. 61% of Arizonans reside in Maricopa County, which translates to a population density of approximately 481.3 people per square mile, or 57,959.3 square feet per resident. In contrast, southeastern Arizona’s Greenlee County claims only 0.14% of the state’s residents for a population density of 5.7, or approximately 4.8M square feet per person. -
 2021-02-07
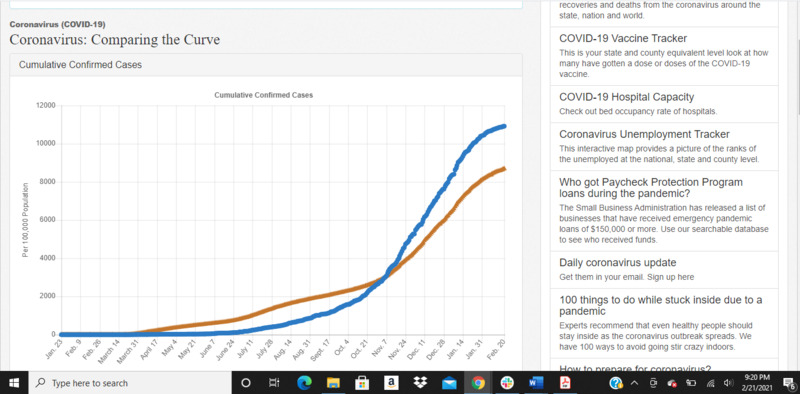
Eddy County, New Mexico: Comparing The Curve
These graphs illustrate the to-date experience of COVID-19 infections and known positivity rates for Eddy County (NM), the State of New Mexico, and the United States. This data demonstrates dichotomies in the experiences of that county, the state, and the nation from the beginning of 2020 through February 6, 2021. Such data provides context to discussions and debate on public behavior, public health policy, and executive actions taken within the State and the County. This is important to me because many of my close and extended family members still reside in and around Eddy County, and the infection rates and restrictions they have endured has been especially tough on them and their community. -
 2020-11-04
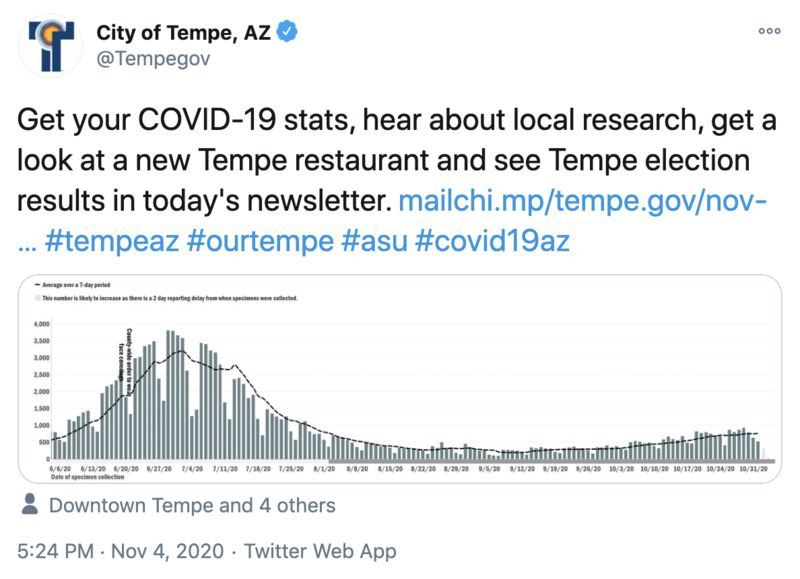
City of Tempe Shows Gradual Rise in Cases
The City of Tempe released an updated graph showing the rise in COVID-19 cases. The graph shows the gradual increase the city is facing currently. While other parts of the nation's cases are skyrocketing at least in Tempe the rise isn't as dramatic. -
 2020-10-29
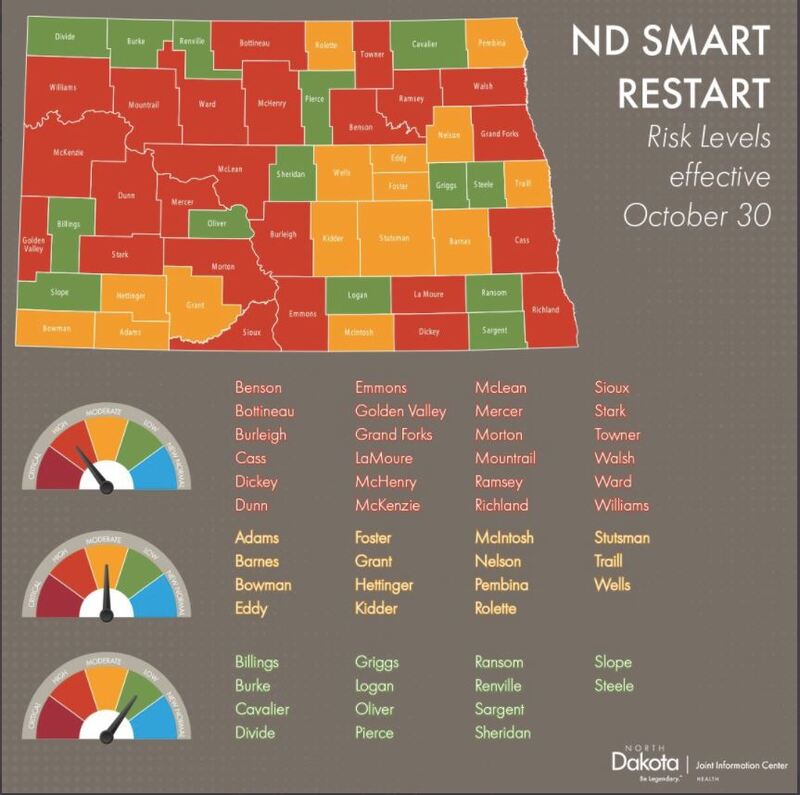
Governor Bergum adjusts COVID-19 risk level for North Dakota counties
In the early stages of the pandemic, North Dakota shut down like every other state. However, during reopening over the summer, safety protocols, such as masks, were not state mandated, only recommended. This has led us to being the state with the highest cases of COVID in the U.S. right now. During Governor Burgum’s press briefing on October 29, 2020 he adjusted the COVID-19 risk levels for various counties in North Dakota, bumping nearly half of the counties in the state into high risk categories and a quarter of the rest into moderate risk. Governor Bergum is still not pushing for a mandate on wearing masks in public areas, only recommending it. -
 2020-07-08
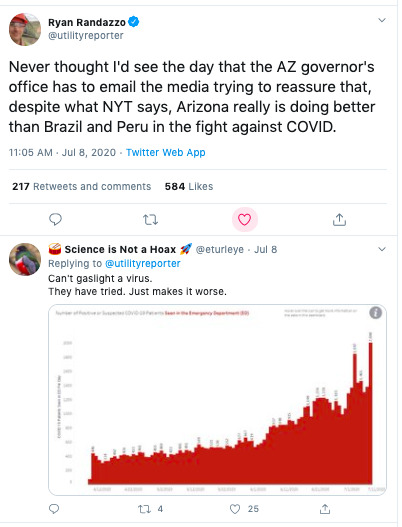
AZ governor's office assures residents its COVID infection rate lower than Brazil or Peru
It's odd that the U.S. response to COVID has been disjointed among national, state, and municipal efforts. Peru had a strong, concerted national effort, but there are so many factors that are contributing to the spiraling infection rate including a day-to-day economy, and the lack of economic support for families. But for officials in Arizona to point the finger and say- hey we're doing better than...seems shameful. Our infection rates could be under control if we followed a systematic public health program. Instead, most businesses are so desperate to reopen like bars and restaurants that they don't really protect customers or staff. The rate of infection among young people started to creep up after Arizona reopened in May, and last week Tempe had to close its bars again to get the situation under control. -
 2020-07-05
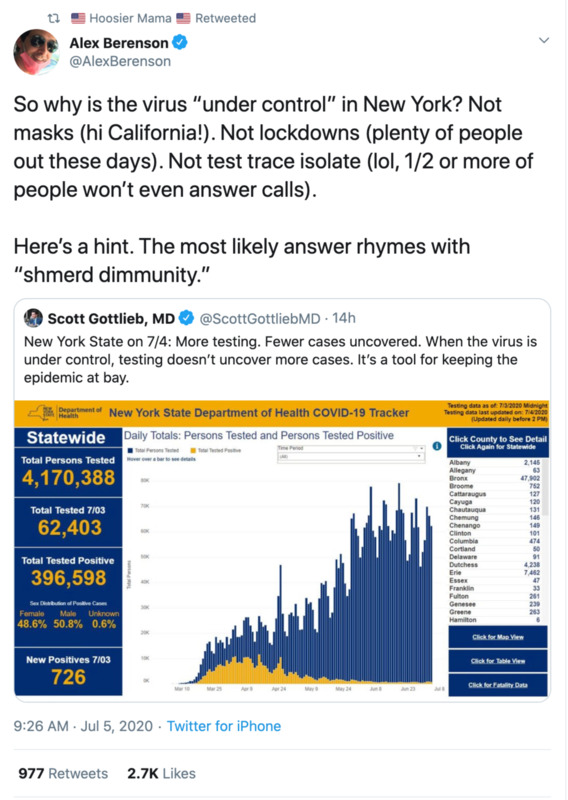
New York vs. California on Coronavirus
New York was one of the original epicenters of the coronavirus back in the beginning of the Spring. As they have managed to get their cases under control, a similarly large state in California has had an explosion in cases. There have been a variety of discussions about how this happened, as people have debated testing, masks, and the idea of herd immunity. This item was added TAGS v6.1.9.1. I originally searched under the hashtag #california. Within that search, I have chosen to add the following tweet because it provides a comparison of two heavily populated states attempts at handling the pandemic. -
 2020-06-19
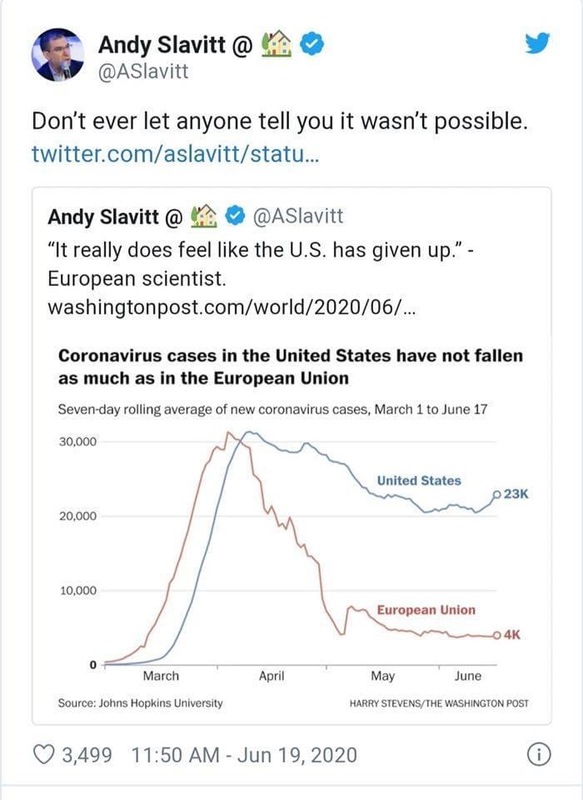
A Tale of Two Curves
With the United States and many countries in Europe experiencing a similar timeline in coronavirus developments, I had hope that we collectively could buckle down as a country and flatten the curve. It was encouraging to hear stories coming out of Europe of a declining death toll, and various state and local governments in the US seemed to be having some luck in managing to contain the rise in cases. But as summer began and the country reopened, it really does appear to be that we want to pretend the coronavirus has just gone away; the numbers paint a disheartening picture. -
 2020-05-01
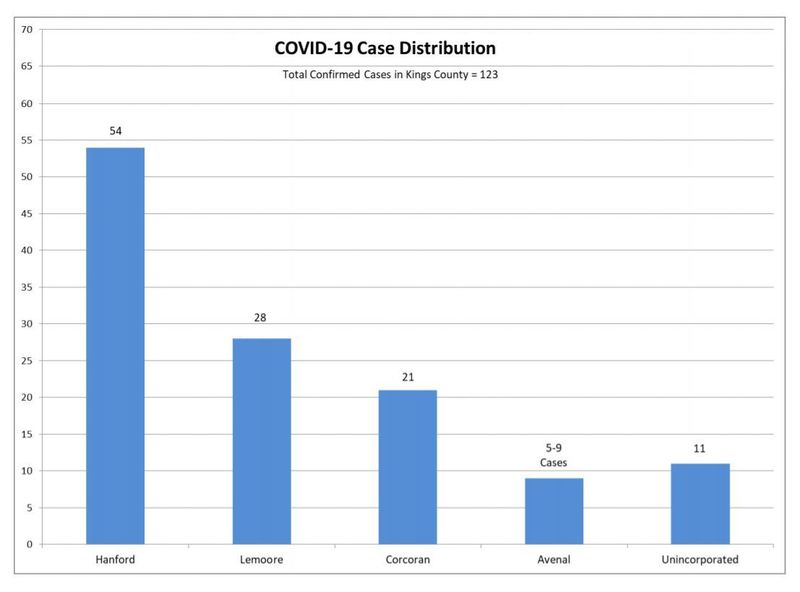
Kings County COVID-19 Cases Surpass 100
I viewed my county as a safe haven because the Kings County only had a handful of positive cases when the stay at home order was established. Now, we have surpassed 100 cases and the positive cases are continuing to rise. -
 2020-04-21
21420
21420 -
 2020-03-16
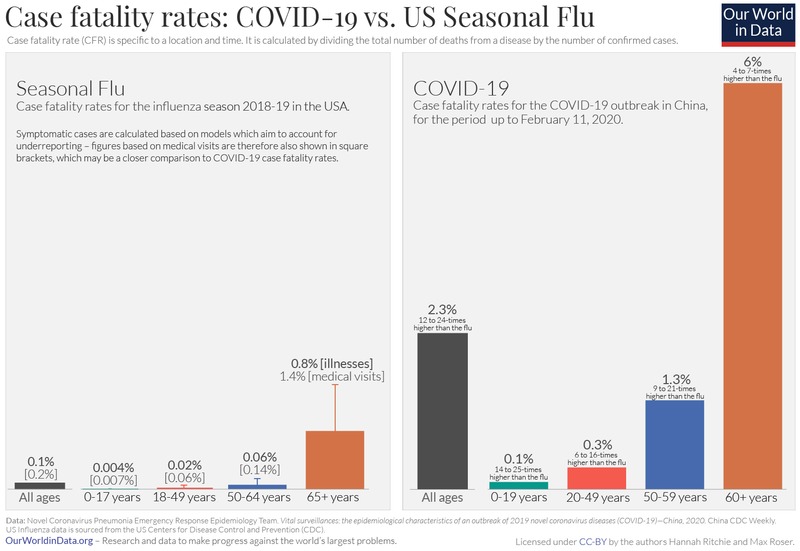
Chart represents CoVid-19 is much more deadly than the seasonal flu
Some of the latest available data on CoVid-19