Items
Tag is exactly
MAP
-
 2021-09-18
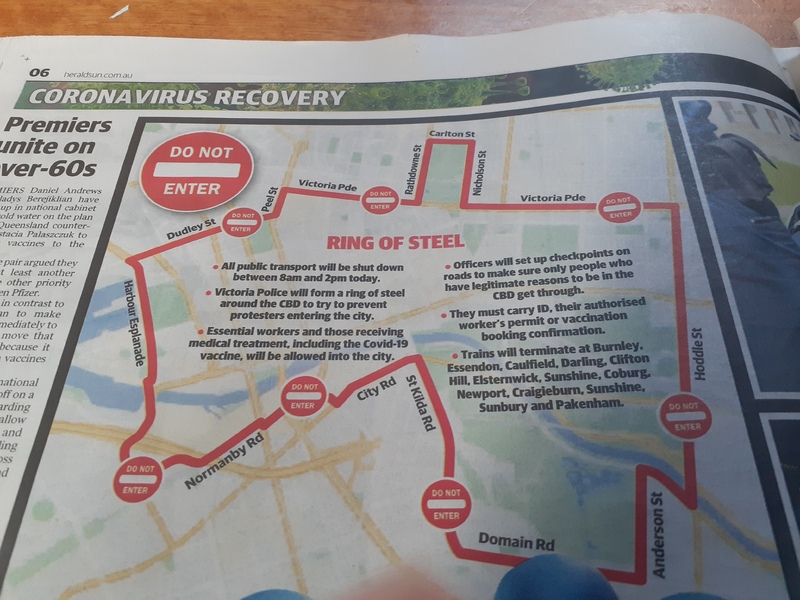
The ring of Steel
This photo shows a newspaper article published during Melbourne's 2021 lockdown. Following significant anti-lockdown protests in the CBD, the police enacted a 'ring of steel' around the CBD to prevent further protests. I was actually turned around at one of the checkpoints (unaware that the city had been shut) earlier that morning on my morning run. This was one of the most dystopian moments from the whole pandemic and highlighted the lengths the government was willing to take to stop the protests in Melbourne. -
 2020-12
The impact of COVID on the LGBTQ+ Community
This PDF details data related to the LGBTQ+ Community's relationship with COVID in America. Based on the data, it is clear many within the community struggled with excessive financial issues, the inability to receive medical care, and the loss of insurance. While the pandemic has placed serious burdens as a whole on society, data such as this is valuable as it allows a look into the most vulnerable communities within society already, and how COVID has destroyed the once normal lives of so many. -
 2021-11-01
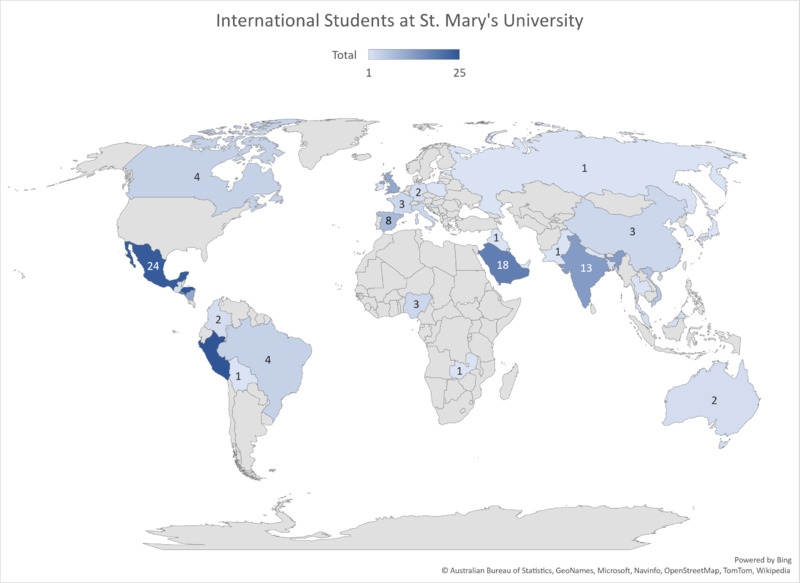
From Every Part of the World! - St. Mary's International Students Map
This map shows how many international students St. Mary's University has in Fall 2021. This year St. Mary's received approximately 50 new international students which is only half of the total they were supposed to have in Fall 2021. In Spring 2022 they hope to receive more than 30 international students, making this map just bigger. The biggest amount of International Students St. Mary's has come from Peru and Honduras, with a total of 25 students. Mexico goes in second place with 24 students and in third place, Saudi Arabia with 18 students. -
 2021
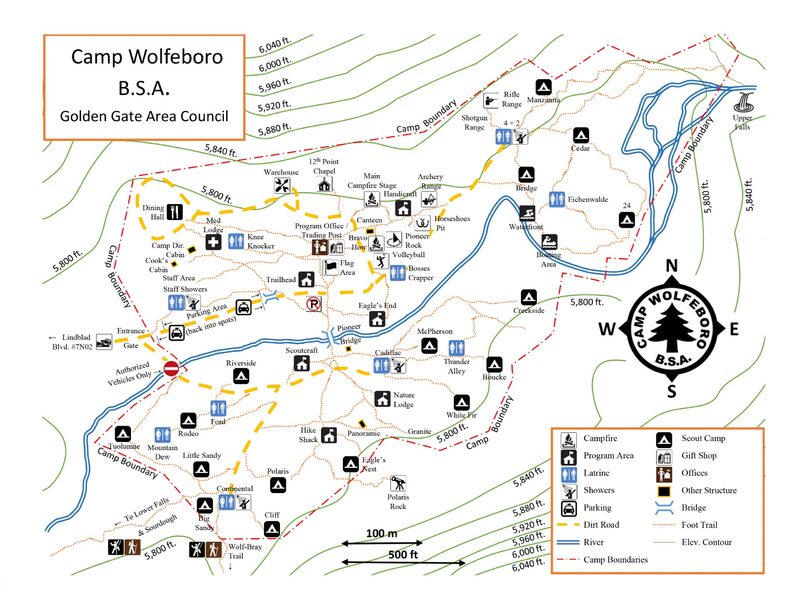
2021Map of Camp Wolfeboro
This is a map of Camp Wolfeboro that was on the Golden Gate Area Council website during the summer of 2021. The map includes the various paths and trails, as well as the program areas, buildings, and campfires. -
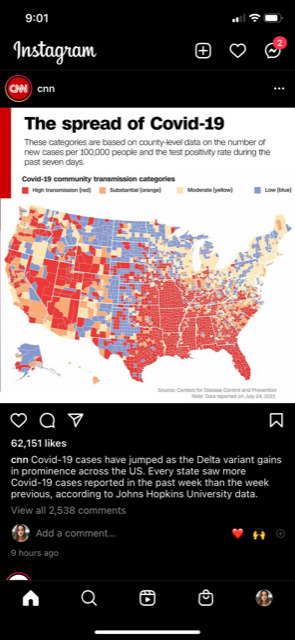 2021-07-28
The spread of Covid-19
"cnn Covid-19 cases have jumped as the Delta variant gains in prominence across the US. Every state saw more Covid-19 cases reported in the past week than the week previous, according to John Hopkins University data." -
 2021-04-19
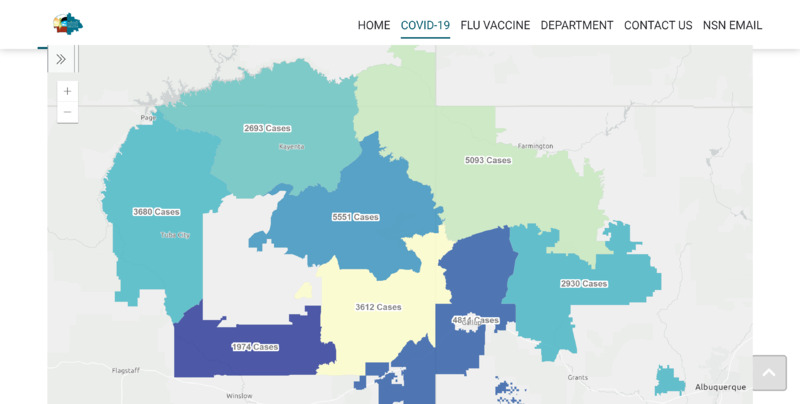
Navajo Department of Health COVID-19 Case Infection Data by Region through 19 April 2021
This image, taken as a screenshot from the Navajo Department of Health website on 19 April 2021, shows COVID-19 infection case data by region within the Navajo Nation. -
 2020
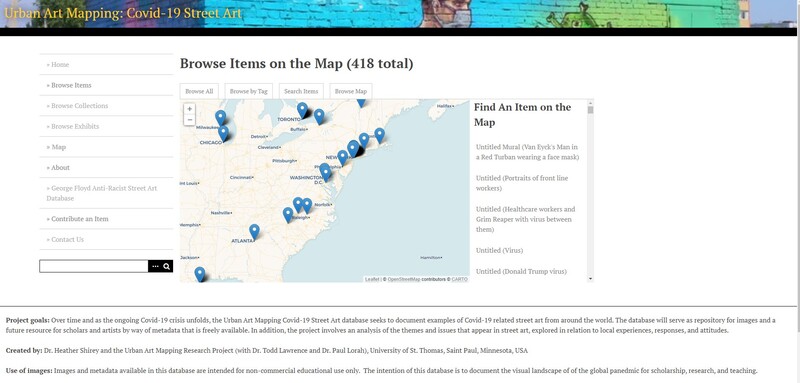
2020Pandemic Street Art: mapping and archiving street art with the University of St. Thomas
This is an archive project created by Dr. Heather Shirey and the Urban Art Mapping Research Project (with Dr. Todd Lawrence and Dr. Paul Lorah), University of St. Thomas, Saint Paul, Minnesota, USA "MAPPING COVID-19 STREET ART: Artists and writers producing work in the streets – including tags, graffiti, murals, stickers, and other installations on walls, pavement, and signs – are in a unique position to respond quickly and effectively in a moment of crisis. Street art’s ephemeral nature serves to reveal very immediate and sometimes fleeting responses, often in a manner that can be raw and direct. At the same time, in the context of a crisis, street art also has the potential to transform urban space and foster a sustained political dialogue, reaching a wide audience, particularly when museums and galleries are shuttered. For all of these reasons, it is not surprising to see an explosion of street art around the world created in response to the Covid-19 global pandemic, even as our movement in public spaces is limited due to public health concerns." -
 2021-04-08
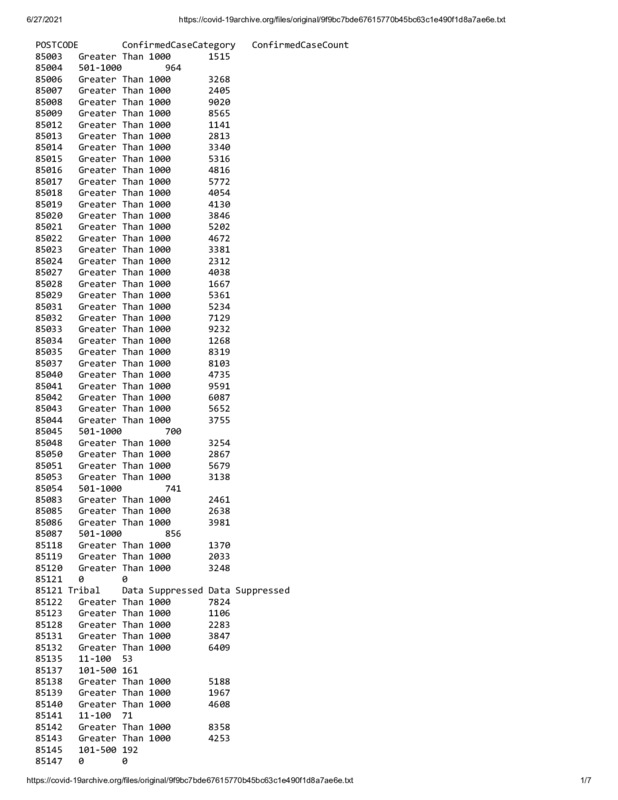
Arizona COVID-19 Infections by Zip Code through 04/08/2021
This text file shows data from the Arizona Department of Health Services for confirmed COVID-19 infections tied to the patient's residential zip code. The data runs through 04/08/2021 and can be searched by "Ctrl + F" and entering specific zip codes. AZDHS suppressed tribal data from this data file prior to its publication on the organization's website. -
 2021
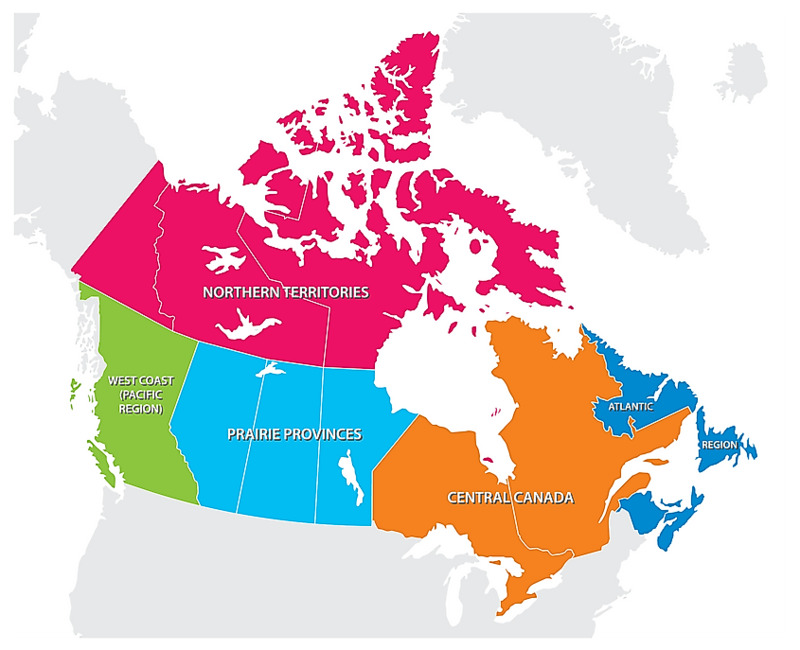
2021The Regions of Canada
This is a map of Canada that shows the regions of the country. -
 2021
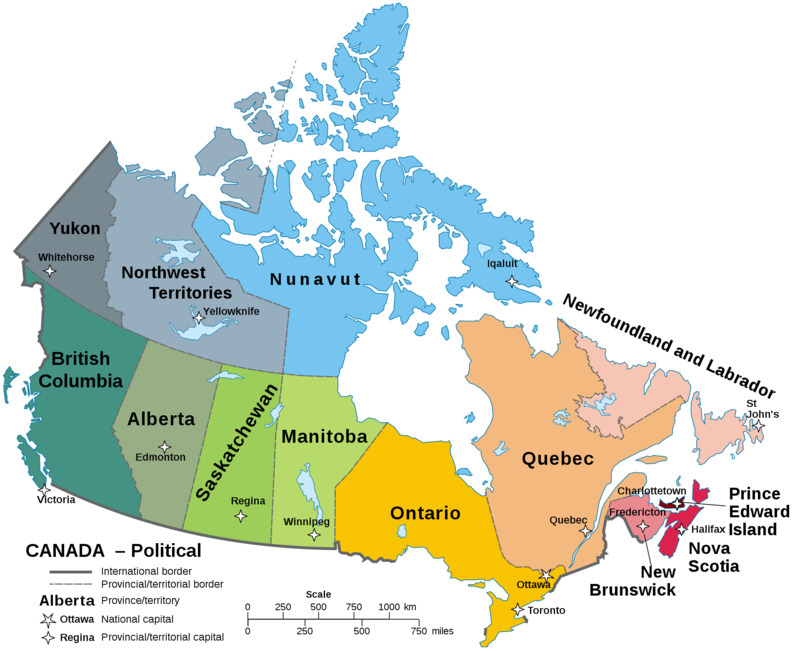
2021Map of Canada
This is a map of Canada that details the provinces and territories. -
 2020-12-13
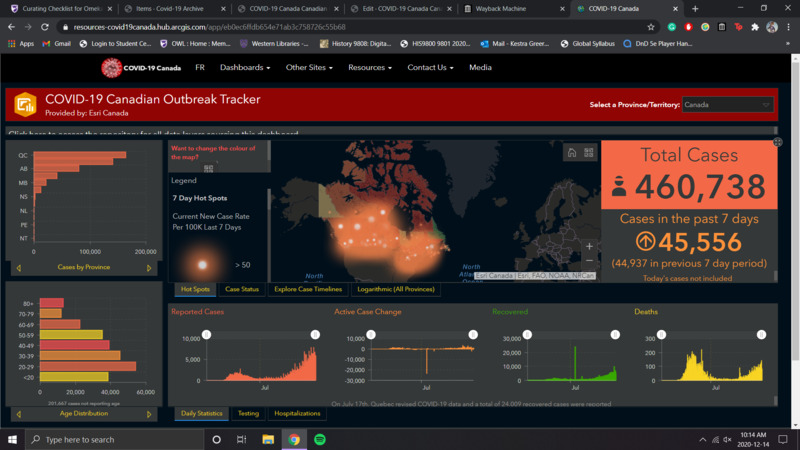
COVID-19 Canada Canadian Outbreak Tracker
This is an interactive outbreak map that provides information regarding the total number of cases, deaths, and recoveries. -
 2020-12-13
Nunavut Health Facilities Map
A Map showing all the active health facilities in Nunavut -
 2020-11-06
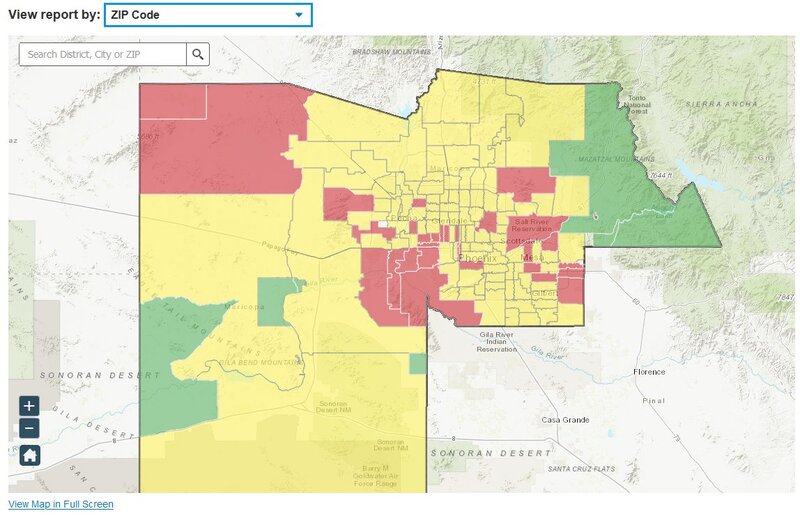
Maricopa County Weekly COVID Cases
Maricopa County released its updated COIVD-19 cases for the week with higher cases in red and lower cases in green. As one of the most populous counties in the U.S. this type of case breakdown is highly important. Since cases are rising dramatically again, its important the public has this type of information. -
 2020-10-23
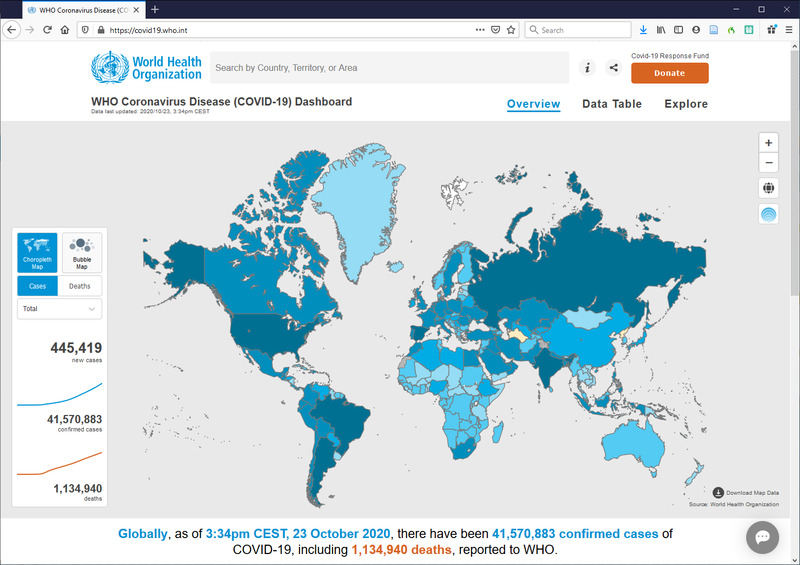
WHO’s COVID-19 Infection map, 23 Oct 2020
The WHO is an authoritative source for tracking COVID-19 infection rates via various countries Centers of Disease Control. For several months, most countries contained COVID-19 infection rates. As expected, infection rates dramatically increased as governments relaxed restrictions. This represented the forecasted second-wave. Unlike the first wave, mortality rates were much lower. Several possible causes from improved pre-vaccinne treatment plans to poor testing and tacking during first wave biased mortality rates. Lastly, it represented born-digital content regarding COVID-19. -
 2020-10-11
The Justice for George Floyd Information Map
As a librarian who works alot with maps, I am very impressed with this site: Justice for George Floyd. This is a way for anyone who wants to protest in the greater NYC area to keep track of upcoming and past events. You can also sign up and add your own events, which will then appear with a description link and an appropriate protesting icon on the map. -
2020-10-05T08:49
covid world map
The article shows where their cases are globally and what trends they are following in different countries. -
 2020-08-30
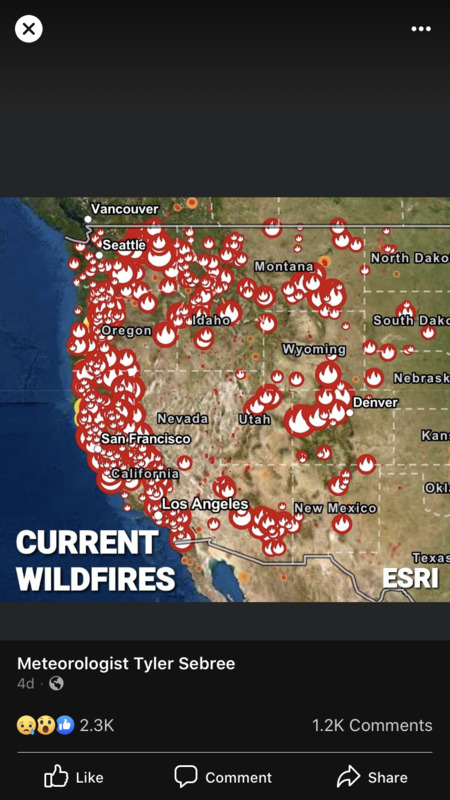
West Coast on Fire
Even though the big story of the year is the Covid-19 pandemic, there is so much more going on behind the scenes of that story. The wildfire season continues to rage on. You hear the stories on the news, but unless you live in one of the areas affected, it can be hard for people to picture. This infographic illustrates just how widespread an area the wildfires affect. -
 2020-08-05
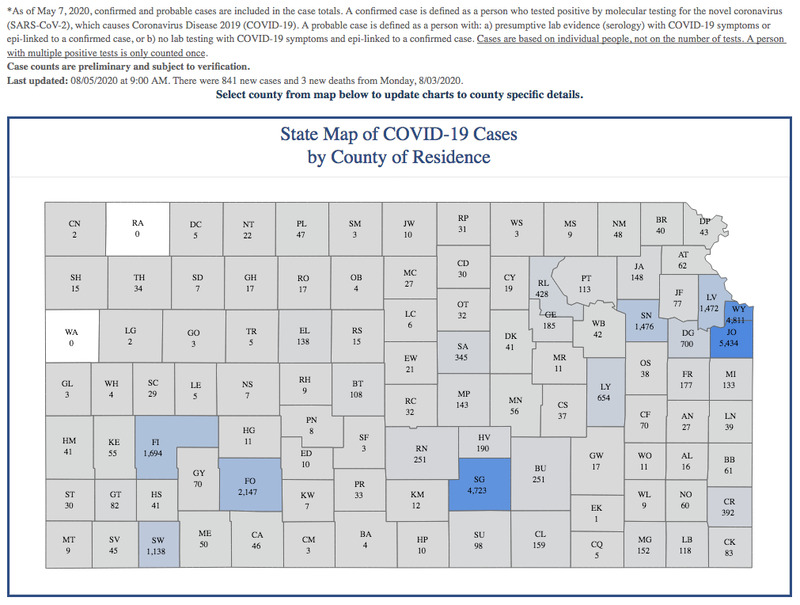
Viral Spread: A Snapshot of Kansas Coronavirus Cases
This screenshot taken on August 5, 2020, captures the virus's spread in the state of Kansas as of that date, with Johnson and Wyandotte Counties ("JO" and "WY"/Kansas City, KS, metro-area), along with Sedgwick County ("SG"/Wichita), leading the state in total number of cases. The two graphs depict the virus's course throughout the spring and summer of 2020, revealing its early rise, decline, and accelerated summer surge. Together, these screenshots offer a snapshot of the effects of a patchwork response and quick reopening, and how quickly virus cases spread as a result. -
 07/02/2020
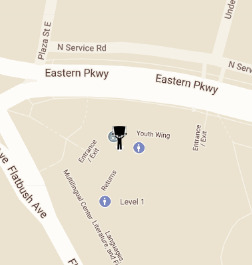
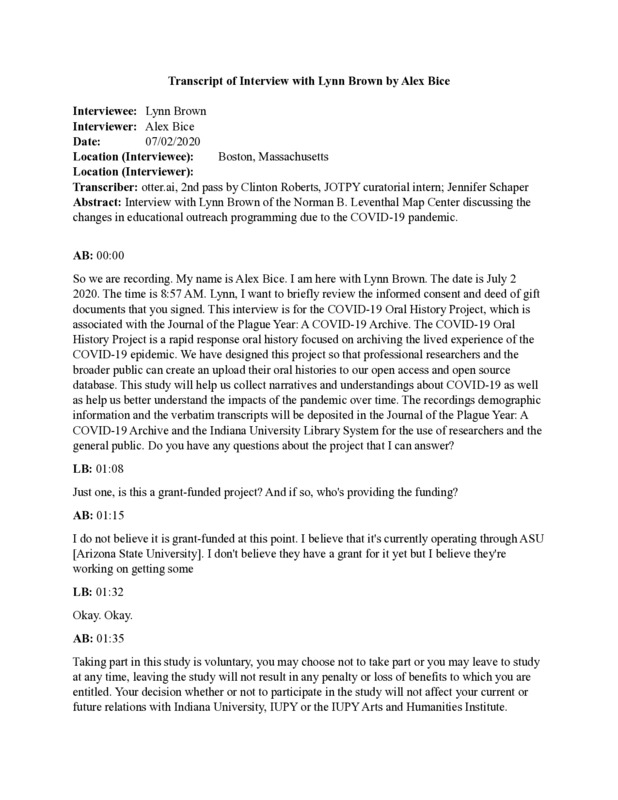
Lynn Brown Oral History, 2020/07/02
Interview with Lynn Brown , Educational Coordinator of the Norman B. Leventhal Map & Education Center by interviewer Alex Bice. Lynn speaks about the importance of group and physical interaction learning. She also shares her thoughts on how the pandemic has altered educational practices for students and teachers during a time of distance learning.