Item
City of Tempe Shows Gradual Rise in Cases
Title (Dublin Core)
City of Tempe Shows Gradual Rise in Cases
Description (Dublin Core)
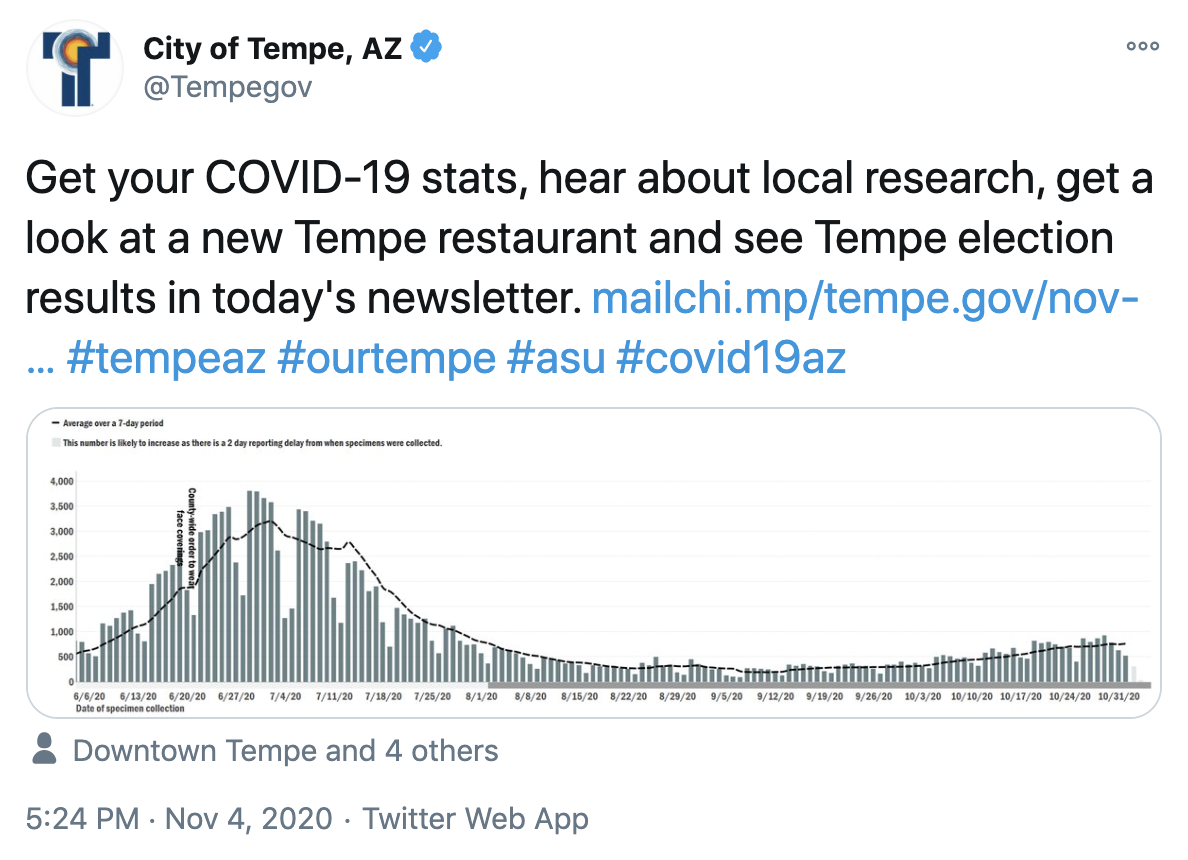
The City of Tempe released an updated graph showing the rise in COVID-19 cases. The graph shows the gradual increase the city is facing currently. While other parts of the nation's cases are skyrocketing at least in Tempe the rise isn't as dramatic.
Date (Dublin Core)
November 4, 2020
Creator (Dublin Core)
City of Tempe
Contributor (Dublin Core)
Patrick Pagnozzi
Event Identifier (Dublin Core)
HSE
Partner (Dublin Core)
Arizona State University
Type (Dublin Core)
Screenshot, Twitter
Link (Bibliographic Ontology)
Controlled Vocabulary (Dublin Core)
English
Social Media (including Memes)
English
Government Local
English
Healthcare
Curator's Tags (Omeka Classic)
Tempe
Arizona
rise
case
graph
case rate
gradual
increase
Twitter
Contributor's Tags (a true folksonomy) (Friend of a Friend)
Tempe
Arizona
HSE
RisingCases
Linked Data (Dublin Core)

Date Submitted (Dublin Core)
02/03/2021
Date Modified (Dublin Core)
11/06/2020
02/08/2021
This item was submitted on November 6, 2020 by Patrick Pagnozzi using the form “Share Your Story” on the site “A Journal of the Plague Year”: https://covid-19archive.org/s/archive
Click here to view the collected data.