Elemento
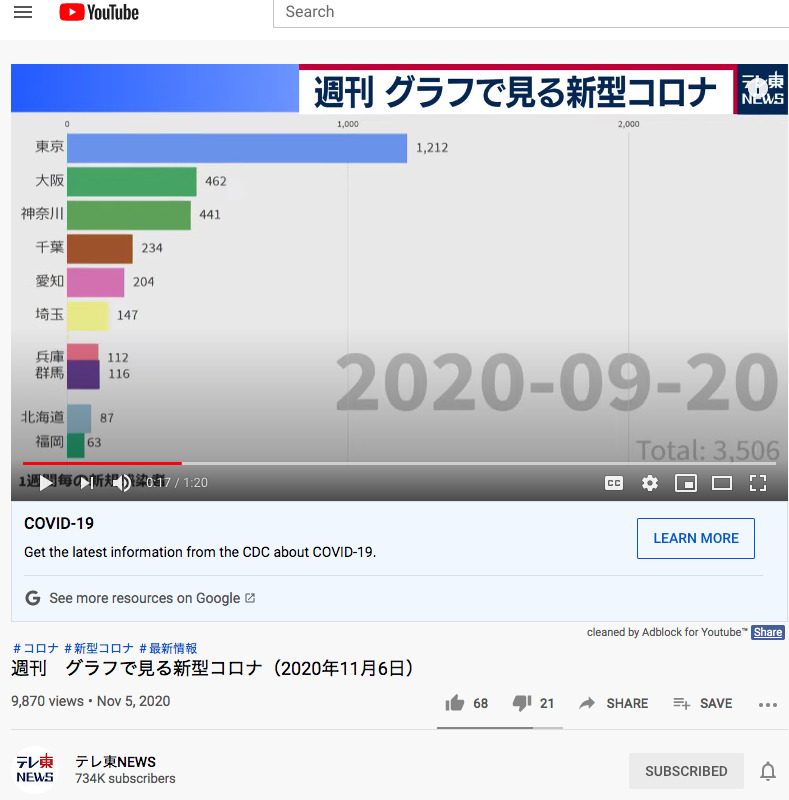
週刊 グラフで見る新型コロナ(2020年11月6日) - Weekly Graph View New Corona (November 6, 2020)
Título (Dublin Core)
週刊 グラフで見る新型コロナ(2020年11月6日) - Weekly Graph View New Corona (November 6, 2020)
Description (Dublin Core)
This video shows the number of cases of COVID-19 in each region of Japan. Tokyo is the capital and the busiest and as you can see, it has the most cases throughout the whole video. 週刊
「グラフで見る新型コロナ」、各自治体などの発表をもとにテレビ東京がまとめた新型コロナウイルス感染症の感染者推移をグラフでお送りします。 まず、1週間ごとの新規感染者の推移を示すグラフです。 首都圏と大阪で感染者数が下げ止まりする状況が続いていて、地域によってはわずかに増えています。そうした中、北海道と愛知県で感染者数が大幅に増えています。愛知県では職場などで小規模のクラスターが多く発生していて、大村知事は「事実上の第三波」との認識を示しました。 次に、地域の医療体制にも影響する一週間毎の人口10万人当たりの新規感染者数です。この1か月の動きを見てみますと、青森や北海道、宮城県など寒い地域で感染が増えていることがわかります。 今週に入ってからは特に北海道が札幌を中心に急速に増えていて、全国で最も多くなりました。道はススキノの酒を出す飲食店での営業時間の短縮要請など、対策を検討しています。
※「1週間毎の新規感染者」はその日からさかのぼって7日間の陽性確認者を足したものです
※「1週間毎の新規感染者(人口10万人当たり)」で使用している人口は2019年10月時点です。
We will show you a graph of the transition of people infected with the new coronavirus, which was compiled by TV TOKYO based on the weekly "New Coronavirus Seen in Graph" and the announcements of each local government.
First, it is a graph showing the transition of newly infected people every week.
The number of infected people continues to decline in the Tokyo metropolitan area and Osaka, and is increasing slightly in some areas. Under such circumstances, the number of infected people has increased significantly in Hokkaido and Aichi prefectures. In Aichi Prefecture, there are many small clusters in the workplace, and Governor Omura has indicated that it is the "de facto third wave."
Next is the number of new infections per 100,000 population per week, which also affects the local health care system. Looking at the movements over the past month, we can see that infections are increasing in cold regions such as Aomori, Hokkaido, and Miyagi prefectures.
Since the beginning of this week, Hokkaido has increased rapidly, especially in Sapporo, and it has become the largest number in Japan. Michi is considering measures such as requesting shortening of business hours at restaurants that serve Susukino sake.
Video is translated by Youngbin Noh
Date (Dublin Core)
November 6, 2020
Creator (Dublin Core)
テレ東NEWS
Contributor (Dublin Core)
Youngbin Noh
Event Identifier (Dublin Core)
HSE
Partner (Dublin Core)
Arizona State University
Tipo (Dublin Core)
screenshot
video
Link (Bibliographic Ontology)
Publisher (Dublin Core)
Youtube
Controlled Vocabulary (Dublin Core)
English
Government State
English
Health & Wellness
English
News coverage
Curator's Tags (Omeka Classic)
COVID-19
case numbers
infection rate
Japan
Hokkaido
Aichi
Sapporo
Contributor's Tags (a true folksonomy) (Friend of a Friend)
number of cases
graph
Japan
Linked Data (Dublin Core)
Date Submitted (Dublin Core)
11/10/2020
Date Modified (Dublin Core)
12/09/2020
Date Created (Dublin Core)
11/05/2020
This item was submitted on November 10, 2020 by Youngbin Noh using the form “Share Your Story” on the site “A Journal of the Plague Year”: https://covid-19archive.org/s/archive
Click here to view the collected data.

